Top 3 Price Prediction Bitcoin, Ethereum, Ripple: $348M in matured derivatives boost the market
- Futures and options contracts' expiration brings a wave of volatility to the crypto market.
- Ethereum takes advantage and attacks resistances in the market dominance chart, Bitcoin goes back.
- Ripple disappoints despite regaining the third place in market capitalization.

Today is a day of expiration in the derivatives market and the volatility of these days began to impact the market at the close of the American session. Cardano (ADA) has been in charge of putting us on alert by chaining violent ups and downs.
Expiration days in the Options and Futures market usually move the market a lot and send false signals. Still, it is exciting to observe what prices do when the expiration passes and the markets are already free of exogenous conditions.
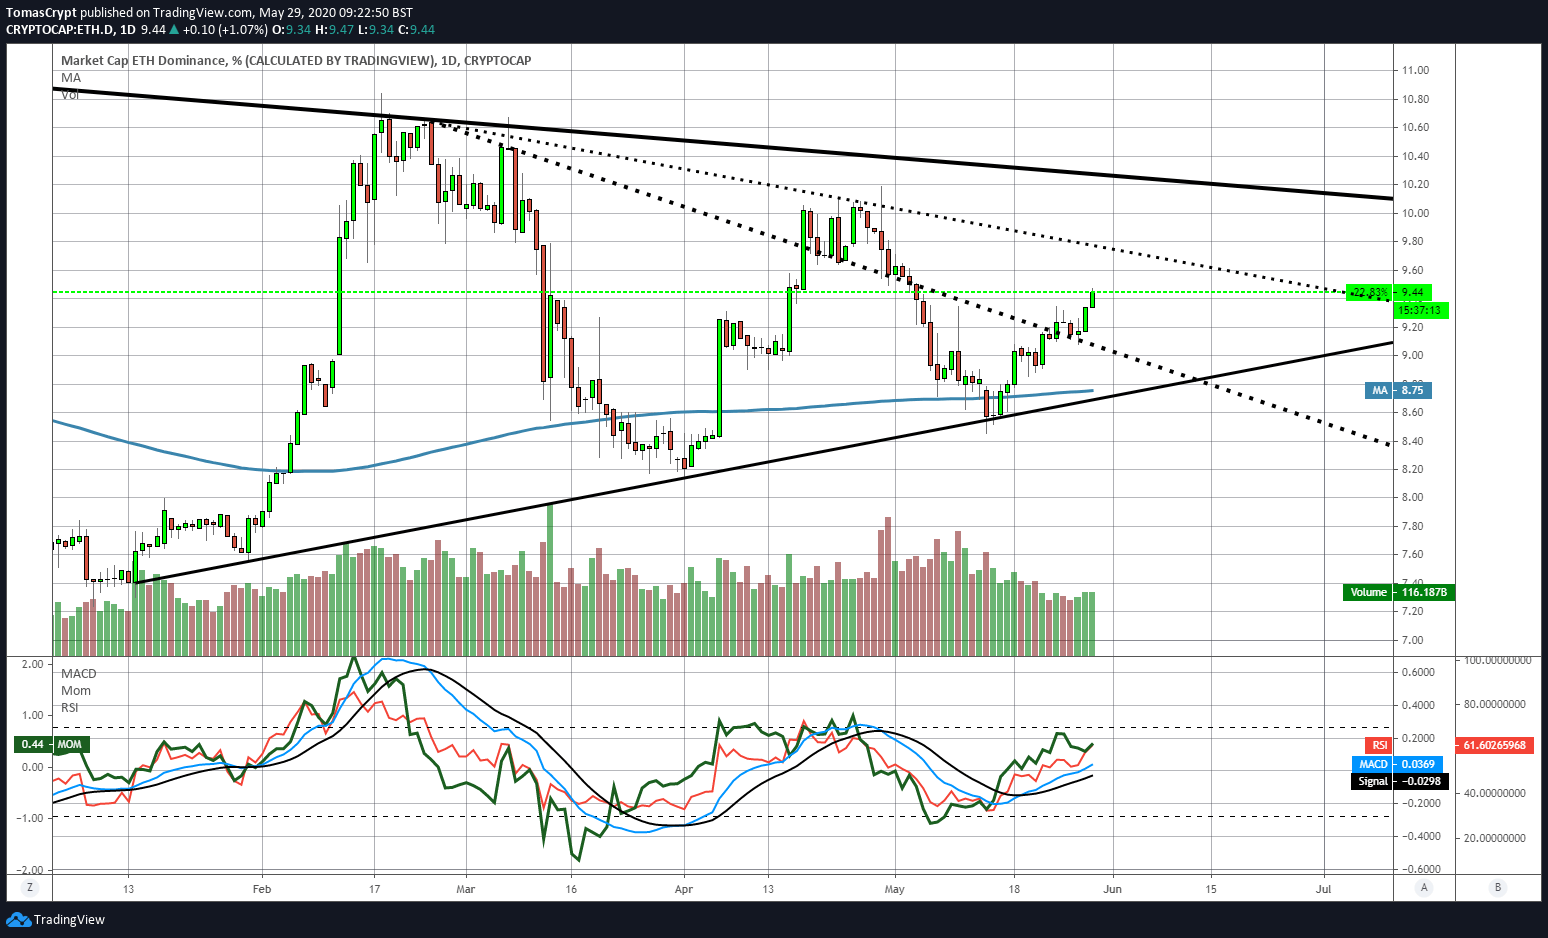
During the opening hours of the European session, Ethereum is rising sharply, not only against fiduciary coins but also against Bitcoin, in another chapter of the war for dominance that confronts them.
Ethereum responds to Bitcoin's frustrated upward attempt a few hours ago. The BTC dominance chart has broken through all levels of resistance. For a few minutes, the Bitcoin dominance price level entered into a scenario with the ingredients to push the price of Bitcoin beyond the moon, and the Altcoins into the loser's mud.
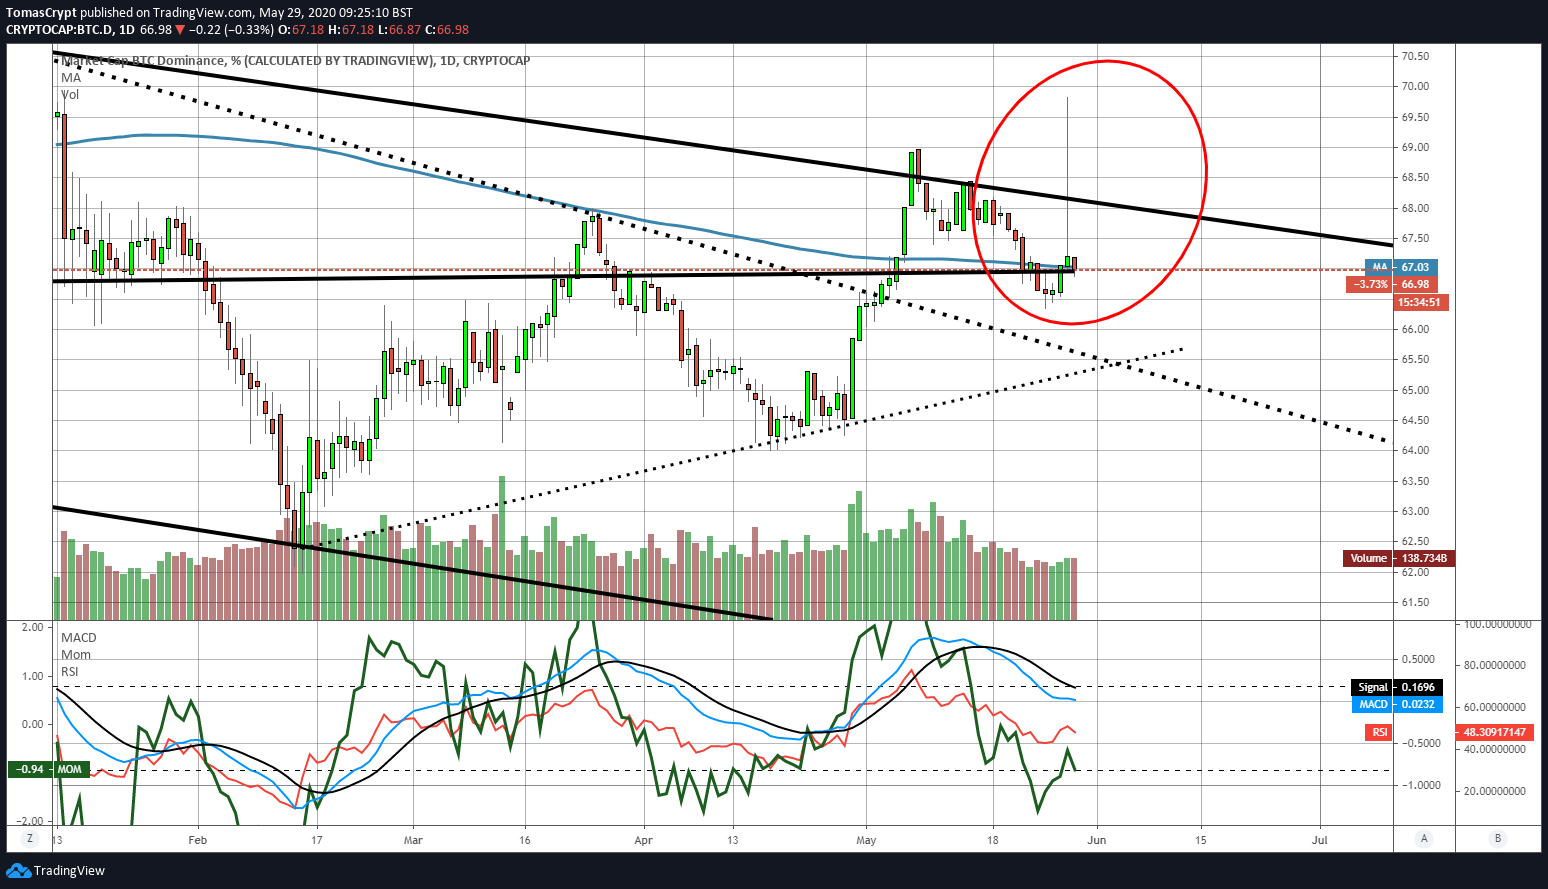
Now the stage has been turned upside down, and Bitcoin suffers from resisting above the 67% market share level.
Ethereum shows potential to continue to rise against Bitcoin and has room to move from the current dominance level of 9.41% to the resistances of 9.75% first and 10.25% later.
The crypto universe is happy to buy into the bullish move and shows it with a 20% improvement in the sentiment level to level 48. It's still not enough to get out of the pessimistic zone. In my opinion, if there is a scary feeling with the Bitcoin near $10000, the upside potential before reaching the euphoria is enormous.
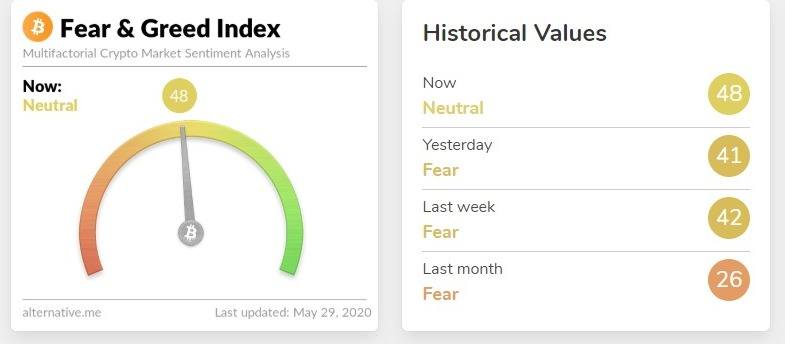
Source: alternative.me
ETH/BTC Daily Chart
The ETH/BTC pair is currently trading at the price level of 0.0233. It is retreating from the 0.234 level where the 100-day simple average has stopped the rise. Ether shows a strong structure, so one cannot rule out seeing the 0.24 level in the short term.
Above the current price, the first resistance level is at 0.0234, then the second at 0.0245 and the third one at 0.0254.
Below the current price, the first support level is at 0.0228, then the second at 0.0221 and the third one at 0.0217.
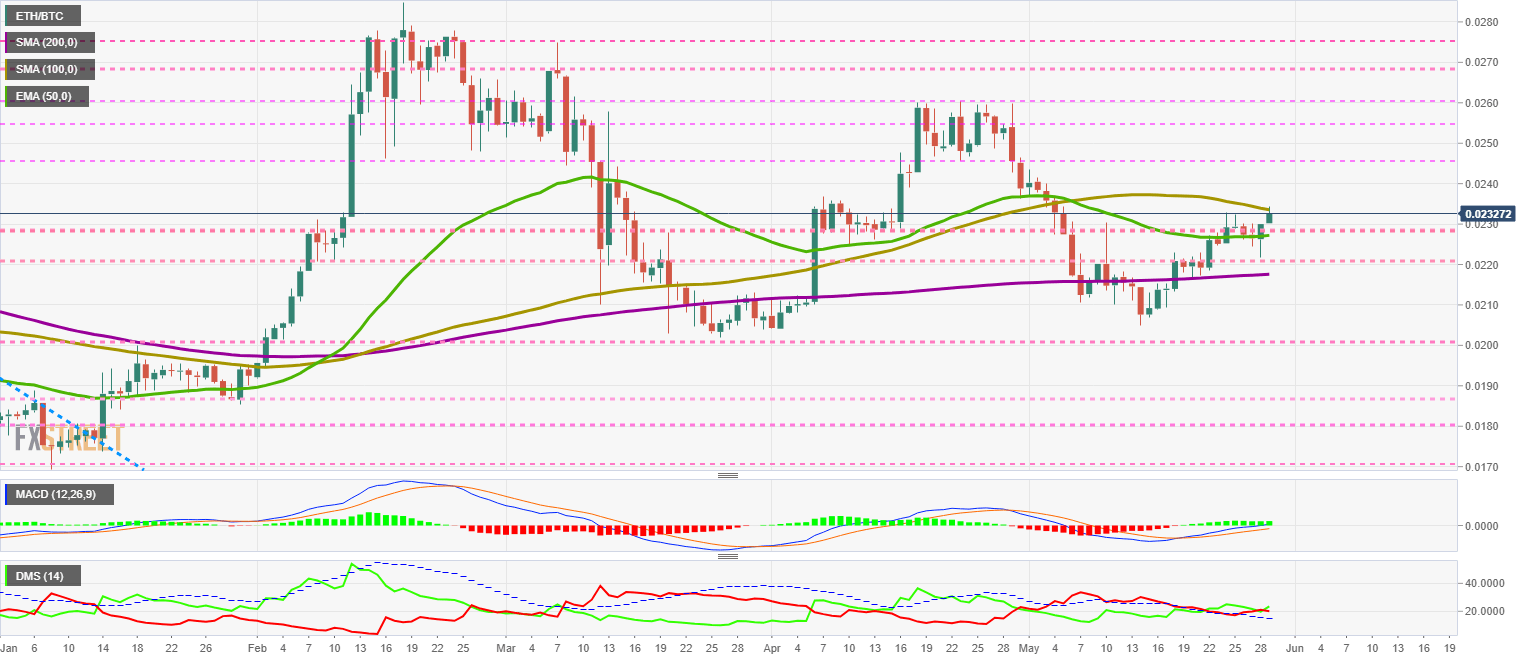
The MACD on the daily chart is beginning to cross the neutral level, a task that seemed difficult yesterday but looks much better today thanks to the new money coming in from Ethereum.
The DMI on the daily chart shows the bulls trying to take advantage, from the position of balance between the two market forces they had yesterday.
BTC/USD Daily Chart
The BTC/USD pair is currently trading at the price level of $9477 after failing to break through the critical resistance level of $9660 in a first attempt. The main moving averages are improving in profile and are hinting at a companion to the long-awaited interstellar journey.
Above the current price, the first resistance level is at $9660, then the second at $10250 and the third one at $10660.
Below the current price, the first support level is at $9120, then the second at $8750 and the third one at $8400.
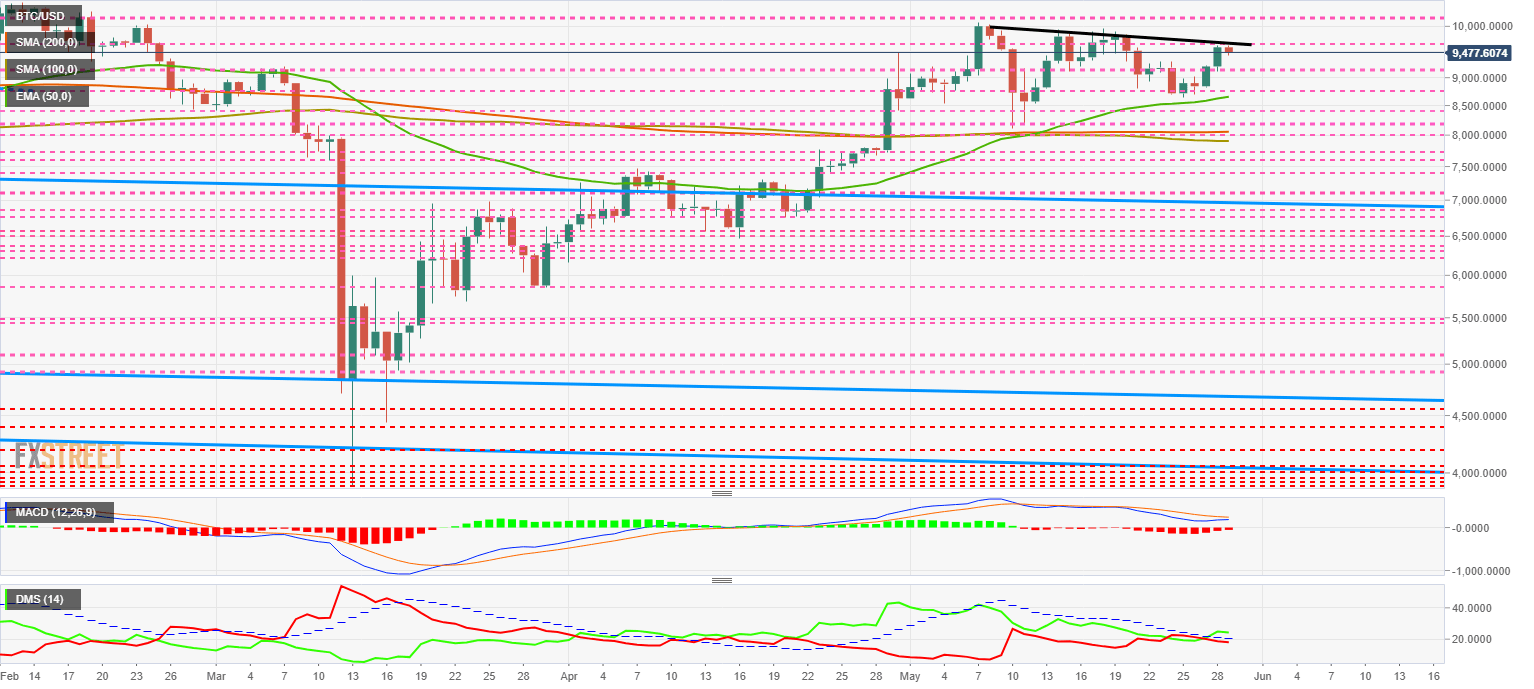
The MACD on the daily chart shows intentions to cross over to the upside. Although the current profile is not optimal for a bullish cross, if the optimistic tone consolidates Bitcoin will receive enough support to make it.
The DMI on the daily chart shows the bulls moving out of the risk zone and putting space between them and the bears. The buy-side is retreating for now, but not enough to rule out a sudden change in leadership in the BTC/USD pair.
ETH/USD Daily Chart
The ETH/USD pair is currently trading at $220.5 after a first failed attempt to break through the price congestion resistance at $223. The 50-day exponential moving average is gaining momentum and could eventually drag up the longer-term moving averages.
Above the current price, the first resistance level is at $223.2, then the second at $228.7 and the third one at $236.
Below the current price, the first support level is at $215, then the second at $208 and the third one at $200.
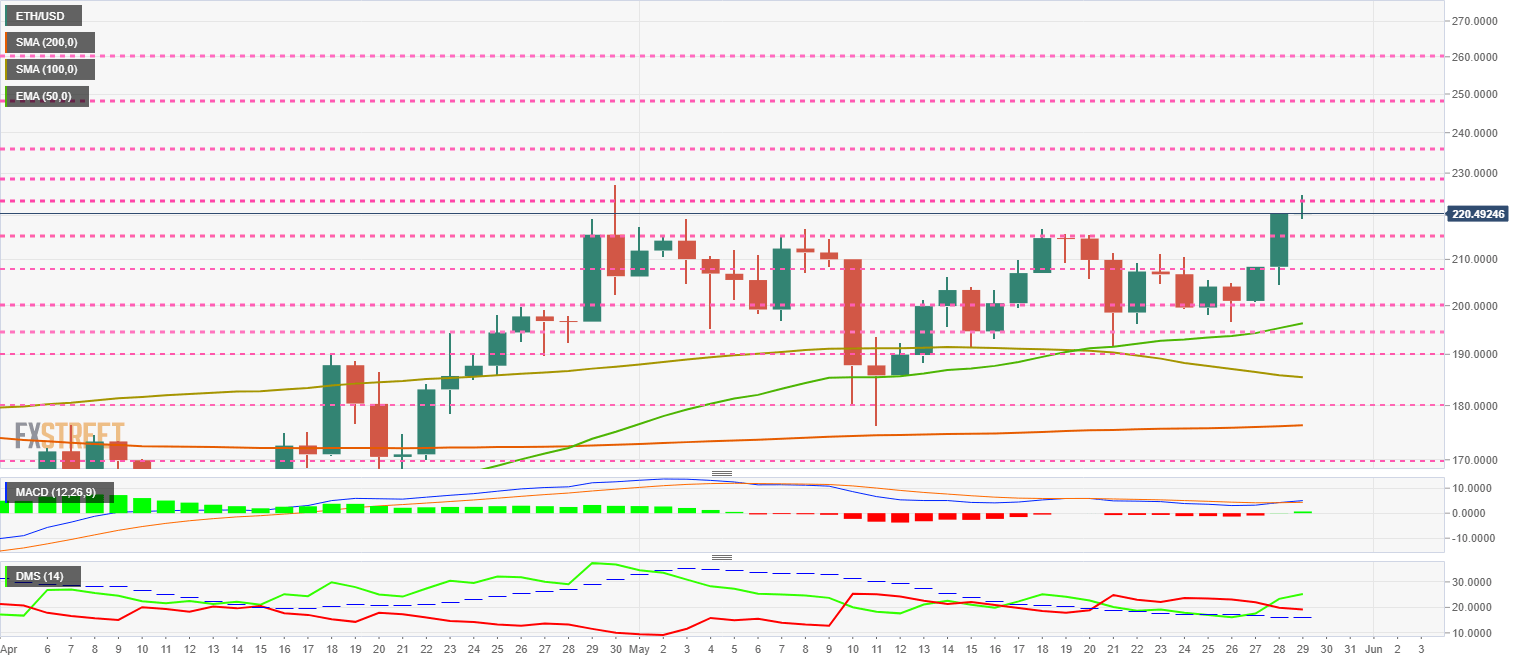
The MACD on the daily chart is crossing upward after bouncing off the neutral level of the indicator. The upward profile of the moving averages is still embryonic but could move quickly to powerful upward momentum.
The DMI on the daily chart shows the bulls gaining height quickly, but continues to be threatened by bears that are still moving above the ADX line.
XRP/USD Daily Chart
The XRP/USD pair is currently trading at a price level of $0.198 and disappointing the expectations for its upward potential. Even the return to the podium of the cryptocurrencies in market capitalization is not enough to arouse buyers' interest. It is more than evident that something is wrong with Ripple.
Above the current price, the first resistance level is at $0.216, then the second at $0.237 and the third one at $0.253.
Below the current price, the first support level is at $0.19, then the second at $0.18 and the third one at $0.163.
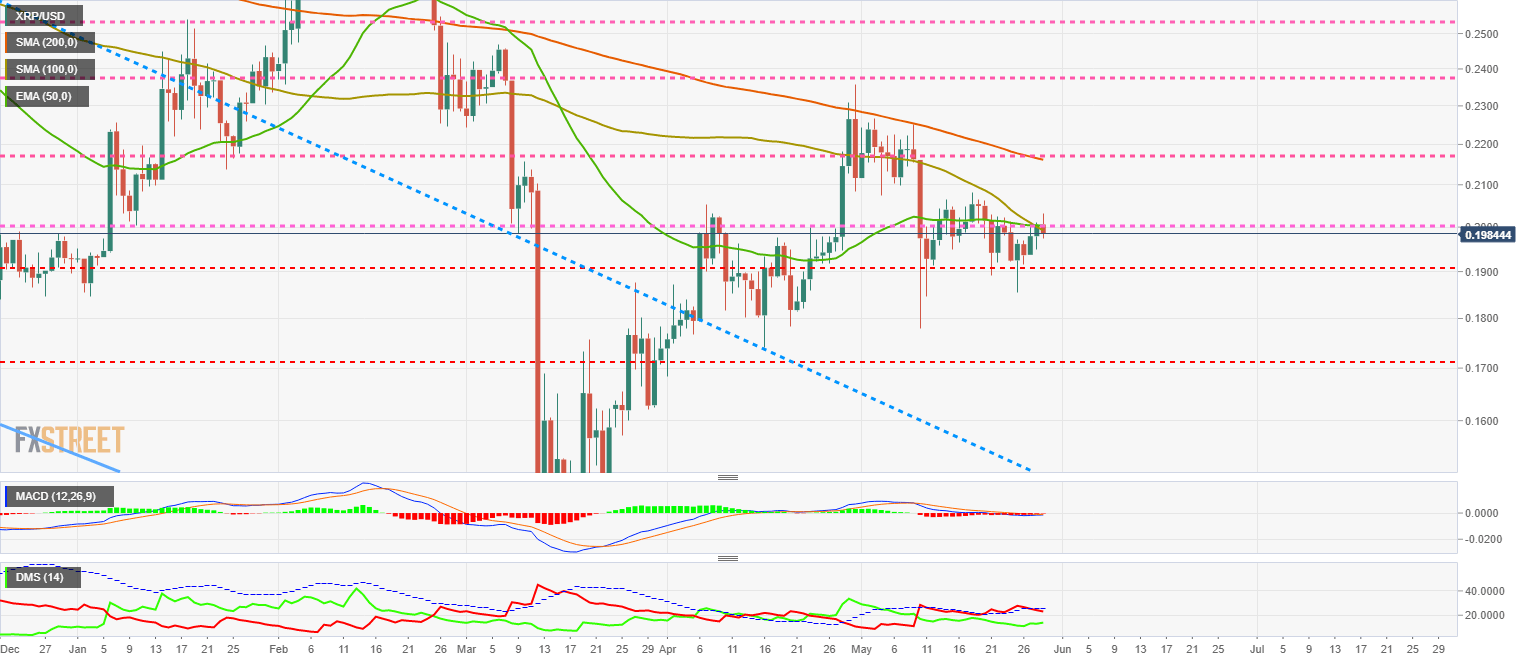
The MACD on the daily chart remains completely flat, at the neutral level of the indicator. The current structure does not provide any visibility in the short term.
The DMI on the daily chart provides some additional information. Bears are losing support from the ADX line while bulls are moving with some intensity upwards.
Author

Tomas Salles
FXStreet
Tomàs Sallés was born in Barcelona in 1972, he is a certified technical analyst after having completing specialized courses in Spain and Switzerland. He expanded his technical training following the guidance of great experts on the financial markets.


