Top 3 Price Prediction Bitcoin, Ethereum and Ripple: Bulls take over following Thursday’s bearish correction
- The Fear and Greed Index is still trending in the “Fear” zone, which shows that the BTC/USD market is still undervalued.
- ETH/BTC has had a bullish session following two straight bearish sessions to re-enter the green Ichimoku cloud.

Bitcoin, Ethereum, and Ripple bears took control this Thursday to correct this Wednesday’s bullish action. The price action of the coins look like this:
- BTC/USD has gone up from $8,626.30 to $8,720.40.
- ETH/USD has gone up from $206.23 to $209.55
- XRP/USD has gone up from $0.2116 to $0.214.
Fear and Greed Index
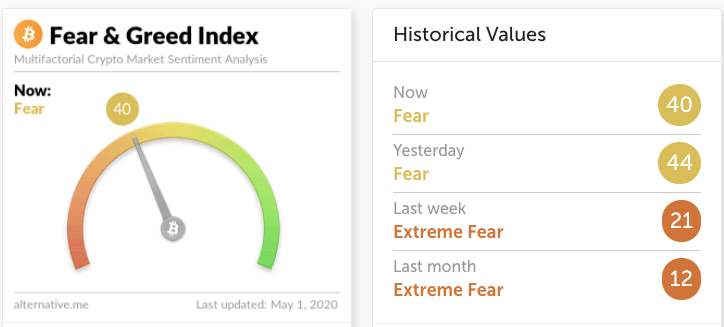
Alternative.me’s fear and greed index has gone down from 44 to 40, and the current market sentiment is still in the “fear” region. This indicates that there is still some upside potential for Bitcoin.
ETH/BTC daily chart
-637238933454743384.png)
ETH/BTC has gone up from 0.0239 to 0.024 in the early hours of Friday, re-entering the green Ichimoku cloud and trending above the upward trending line, in the process. There are two resistance levels at 0.0249 and 0.0255, while there are two support levels on the downside at 0.0235 and 0.0228, the latter of which corresponds to the SMA 50. The MACD indicates increasing bearish momentum, while the Elliott Oscillator has had five straight red sessions.
BTC/USD daily chart
-637238932515736248.png)
BTC/USD has had a bullish start to Friday, following a bearish Thursday as the price consolidates below the $8,800 level. While the 20-day Bollinger jaw has widened, indicating increasing price volatility, BTC/USD is sitting on top of the upper curve of the band, which shows that the asset is currently overpriced and may face more bearish correction. This is further corroborated by the RSI indicator, which is also trending at the edge of the overbought zone.
ETH/USD daily chart
-637238931973079399.png)
ETH/USD went up from $206.23 to $209.55, following a bearish Thursday. The price is trending in an upward channel formation and has previously encountered resistance at the upward trending line and the $217 level. On the downside, ETH/USD has two support levels at $197.20 and $188.55. The RSI has dipped down from the overbought zone and currently is trending around 66.67, while the Elliott OScillator has had 7 straight green sessions.
XRP/USD daily chart
-637238931343285578.png)
XRP/USD has gone up from $0.2116 to $0.214 following a heavily bearish Thursday when the price encountered resistance at the SMA 200 and the $0.2264 line. XRP/USD has found support at the upward trending line and is hovering below the upward curve of the 20-day Bollinger Band. The MACD shows increasing bullish momentum, while the Elliott Oscillator has had seven straight green sessions of growing intensity.
Author

Rajarshi Mitra
Independent Analyst
Rajarshi entered the blockchain space in 2016. He is a blockchain researcher who has worked for Blockgeeks and has done research work for several ICOs. He gets regularly invited to give talks on the blockchain technology and cryptocurrencies.