Top 3 Price Prediction Bitcoin, Ether, Ripple: Extreme fear kicks off a bullish stampede
-
Market sentiment collapsed, returning to March lows.
-
The market has launched multiple bullish signals in a strong reaction against extreme fear.
-
Ripple may have the answer to know which side is right in the next few hours.

In any transaction between two individuals, there is one thing in common, and that is the perception by both parties that the settlement price benefits them in some way.
The two parties must meet at least one need – to generate profit, achieve liquidity, invest or assuage the fear of loss.
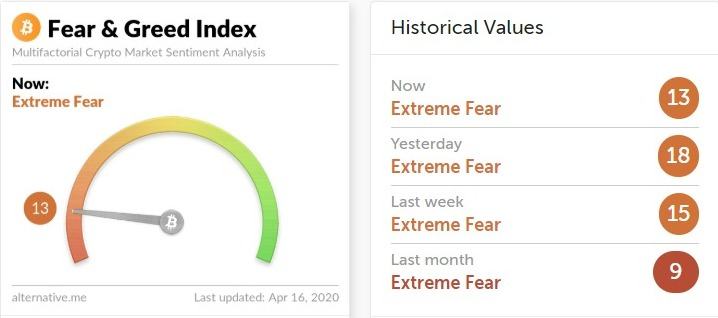
Source: alternative.me
One of the most powerful feelings and one that plays a significant role in these position-taking processes is the fear of losing money. At this time, fear has the mastery of the crypto segment and brings it back to the levels of March.
The price of an asset is the most effective ammunition to trigger an emotion, and it seems that the movement of the BTC/USD pair below $6700 has made many people uncomfortable.
I want to highlight that the market is at a fragile equilibrium point, and a few hundred dollars may decide the scenario that BTC/USD – and the entire crypto segment – will transit in the future. Today, this detail is important because the price is not homogeneous. It depends a lot on the exchange or platform, with vast differences. Right now, with more or less difficulty, you can buy a Bitcoin between the $6400 of the exchange that offers the lowest price and the $6888 of the highest price.
In the face of the collapse in the confidence level, Ether takes its necessary leadership role in the shadow. It moves powerfully upwards to the 9.43 (+3.95) level, enough for the rest of the market to react quickly.
ETH/BTC Daily Chart
The ETH/BTC pair is currently trading at the price level of 0.02421 and is breaking out of the bullish technical pennant figure and heading towards the upward trend line that has been driving the ETH/BTC upward movement since late 2019.
Above the current price, the first resistance level is at 0.0243, then the second at 0.0248 and the third one at 0.0254.
Below the current price, the first level is at 0.0228, then the second at 0.0225 and the third one at 0.0221.
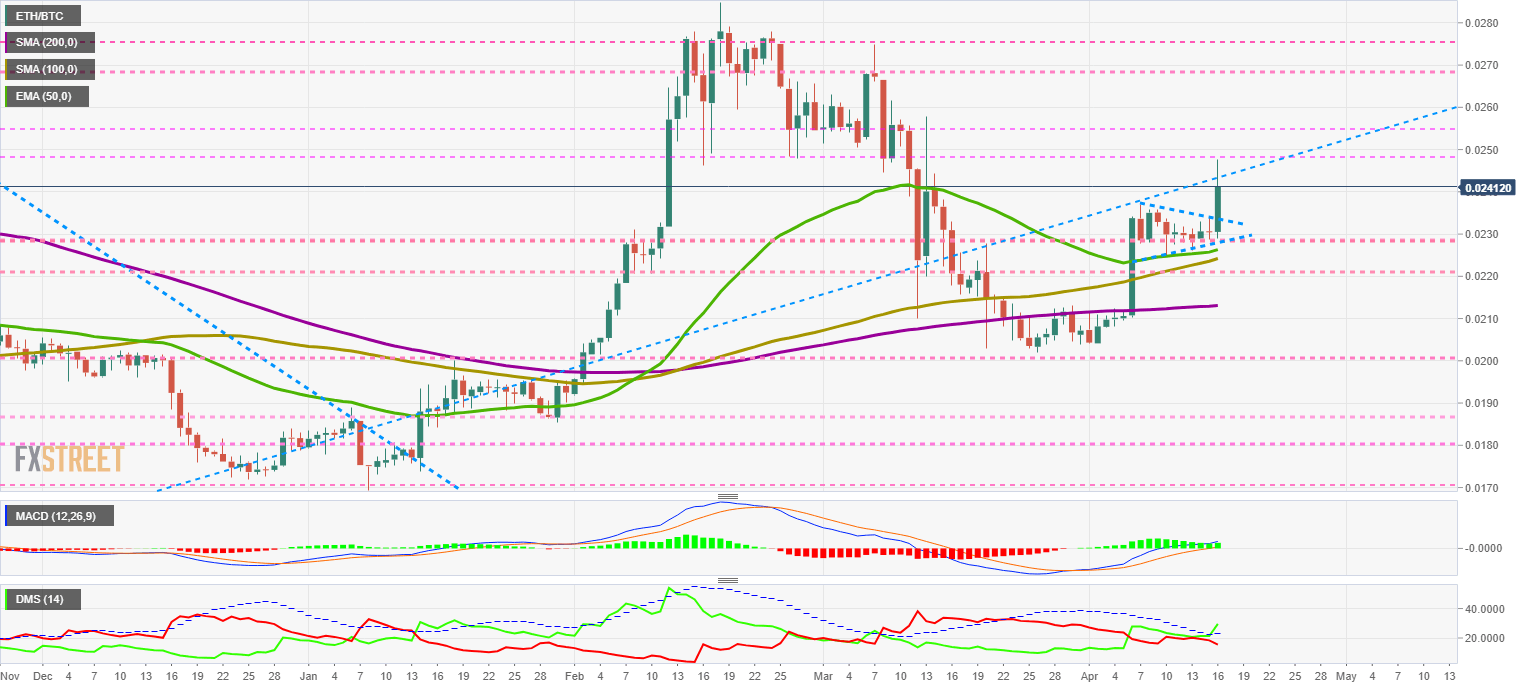
The DMI on the daily chart confirms the bulls' momentary victory and dramatically increases the chances of a consolidation move.
BTC/USD Daily Chart
The BTC/USD pair is currently trading at the price level of $7070 and clearly shows that market price and sentiment are taking opposite paths. In the introduction of this article, I have highlighted the prevailing pessimism, with a level 13 or "extreme fear", the price turns around and puts a lot of upward pressure on the resistance levels.
Above the current price, the first resistance level is at $7100, then the second at $7425 and the third one at $7618.
Below the current price, the first support level is at $6750, then the second at $6575 and the third one at $6400.
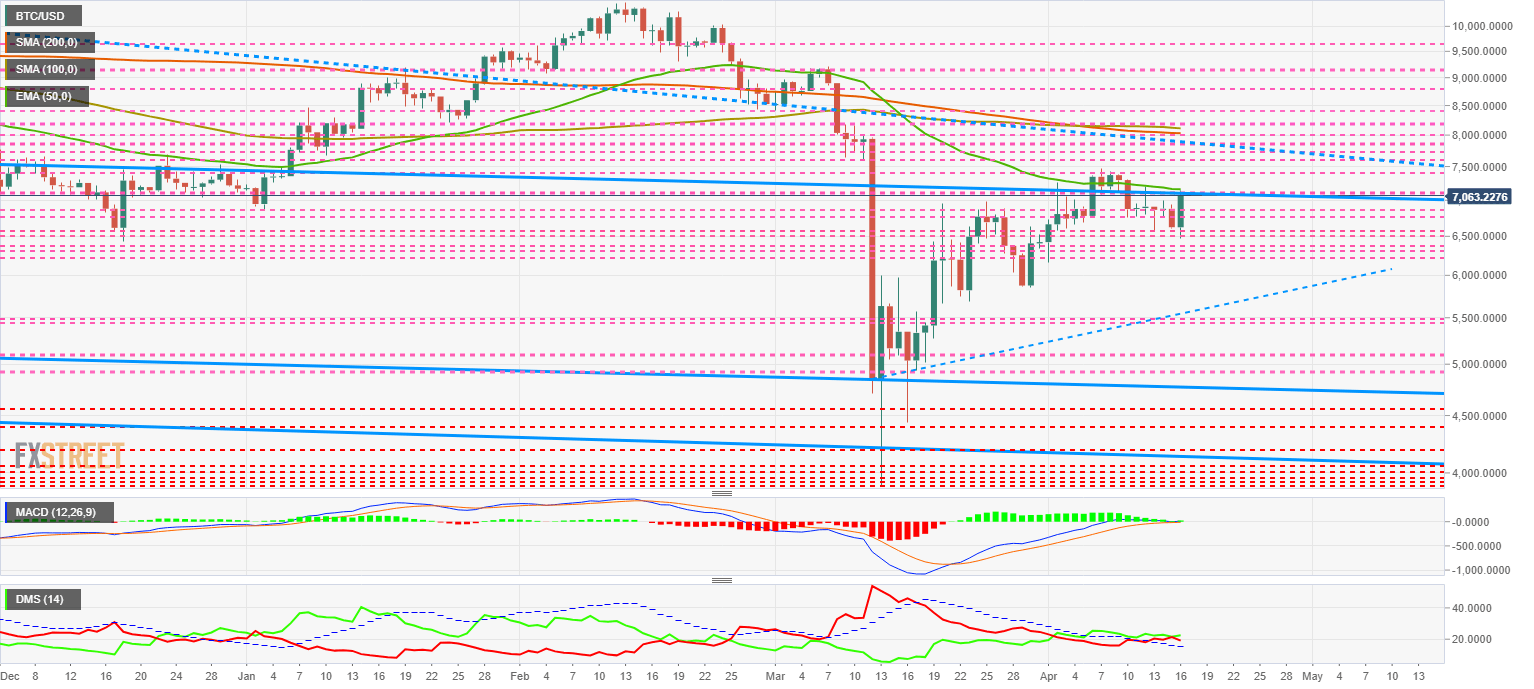
The MACD on the daily chart does not show improvement from yesterday's level. If the BTC/USD pair breaks the first resistance level, we may see a significant change in this indicator.
The DMI on the daily chart shows the bears above the bulls, but without a significant lead.
ETH/USD Daily Chart
The ETH/USD pair is currently trading at $169.85 and is above the 50-day exponential average.
Above the current price, the first resistance level is at $170, then the second at $184 and the third one at $190.
Below the current price, the first support level is at $164, then the second at $155 and the third one at $148.
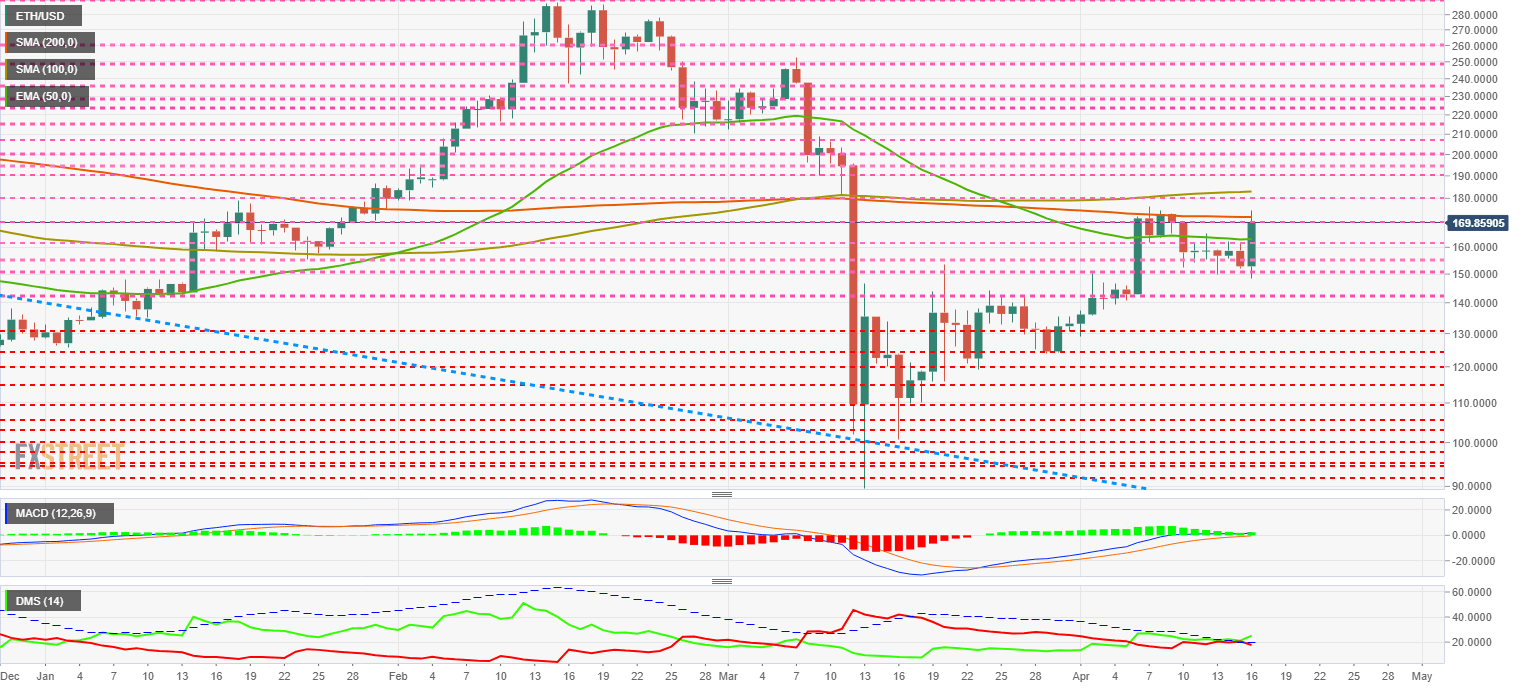
The MACD on the daily chart shows an improvement in the slope and opening between the lines. If the ETH/USD crosses above the $170 resistance level, the improvement in this indicator could be very significant.
The DMI on the daily chart shows the bulls have crossed the ADX line and are gaining momentum. If buyers hold the bullish momentum for two days, the bullish signal could be critical.
XRP/USD Daily Chart
The XRP/USD pair is currently trading at the price level of $0.1897 after confirming the breakout of the long-term bearish channel. The day's low is right at the top of the long-term bearish channel.
Above the current price, the first resistance level is at $0.190, then the second at $0.20 and the third one at $0.22.
Below the current price, the first support level is at $0.173, then the second at $0.17 and the third one at $0.163.
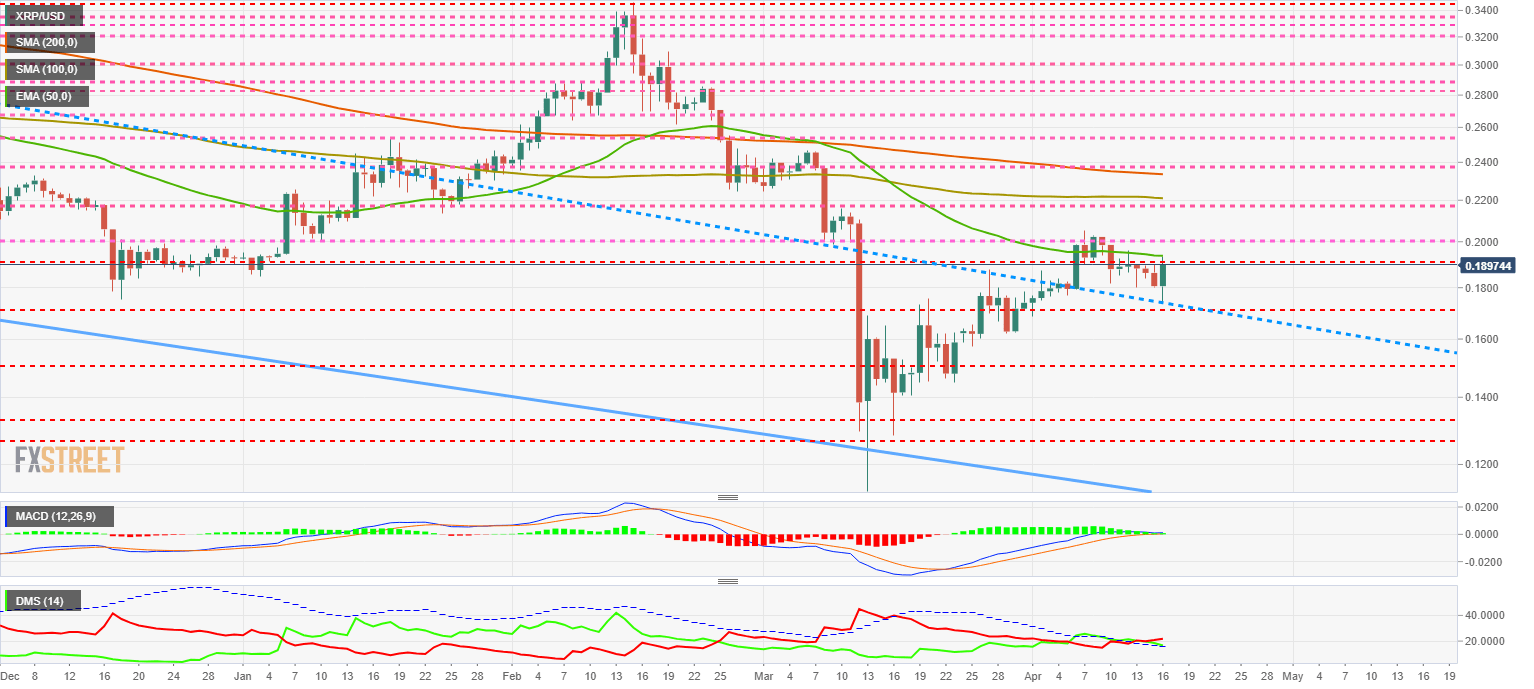
The DMI on the daily chart shows the bears are in control and have a good lead over the bulls. The current structure can only have two developments that fit the expected scenarios for the Bitcoin and the Ether. Either the Ripple explodes with force and reverses the current setup, or it's all a lie, and the crypto market could point down in no time.
Get 24/7 Crypto updates in our social media channels: Give us a follow at @FXSCrypto and our FXStreet Crypto Trading Telegram channel
Author

Tomas Salles
FXStreet
Tomàs Sallés was born in Barcelona in 1972, he is a certified technical analyst after having completing specialized courses in Spain and Switzerland. He expanded his technical training following the guidance of great experts on the financial markets.


