Solana Price Forecast: SOL risks deeper losses amid mixed ETF flows, weak retail interest
- Solana extends losses below $65 on Wednesday, risking the 7% rebound gains from Sunday.
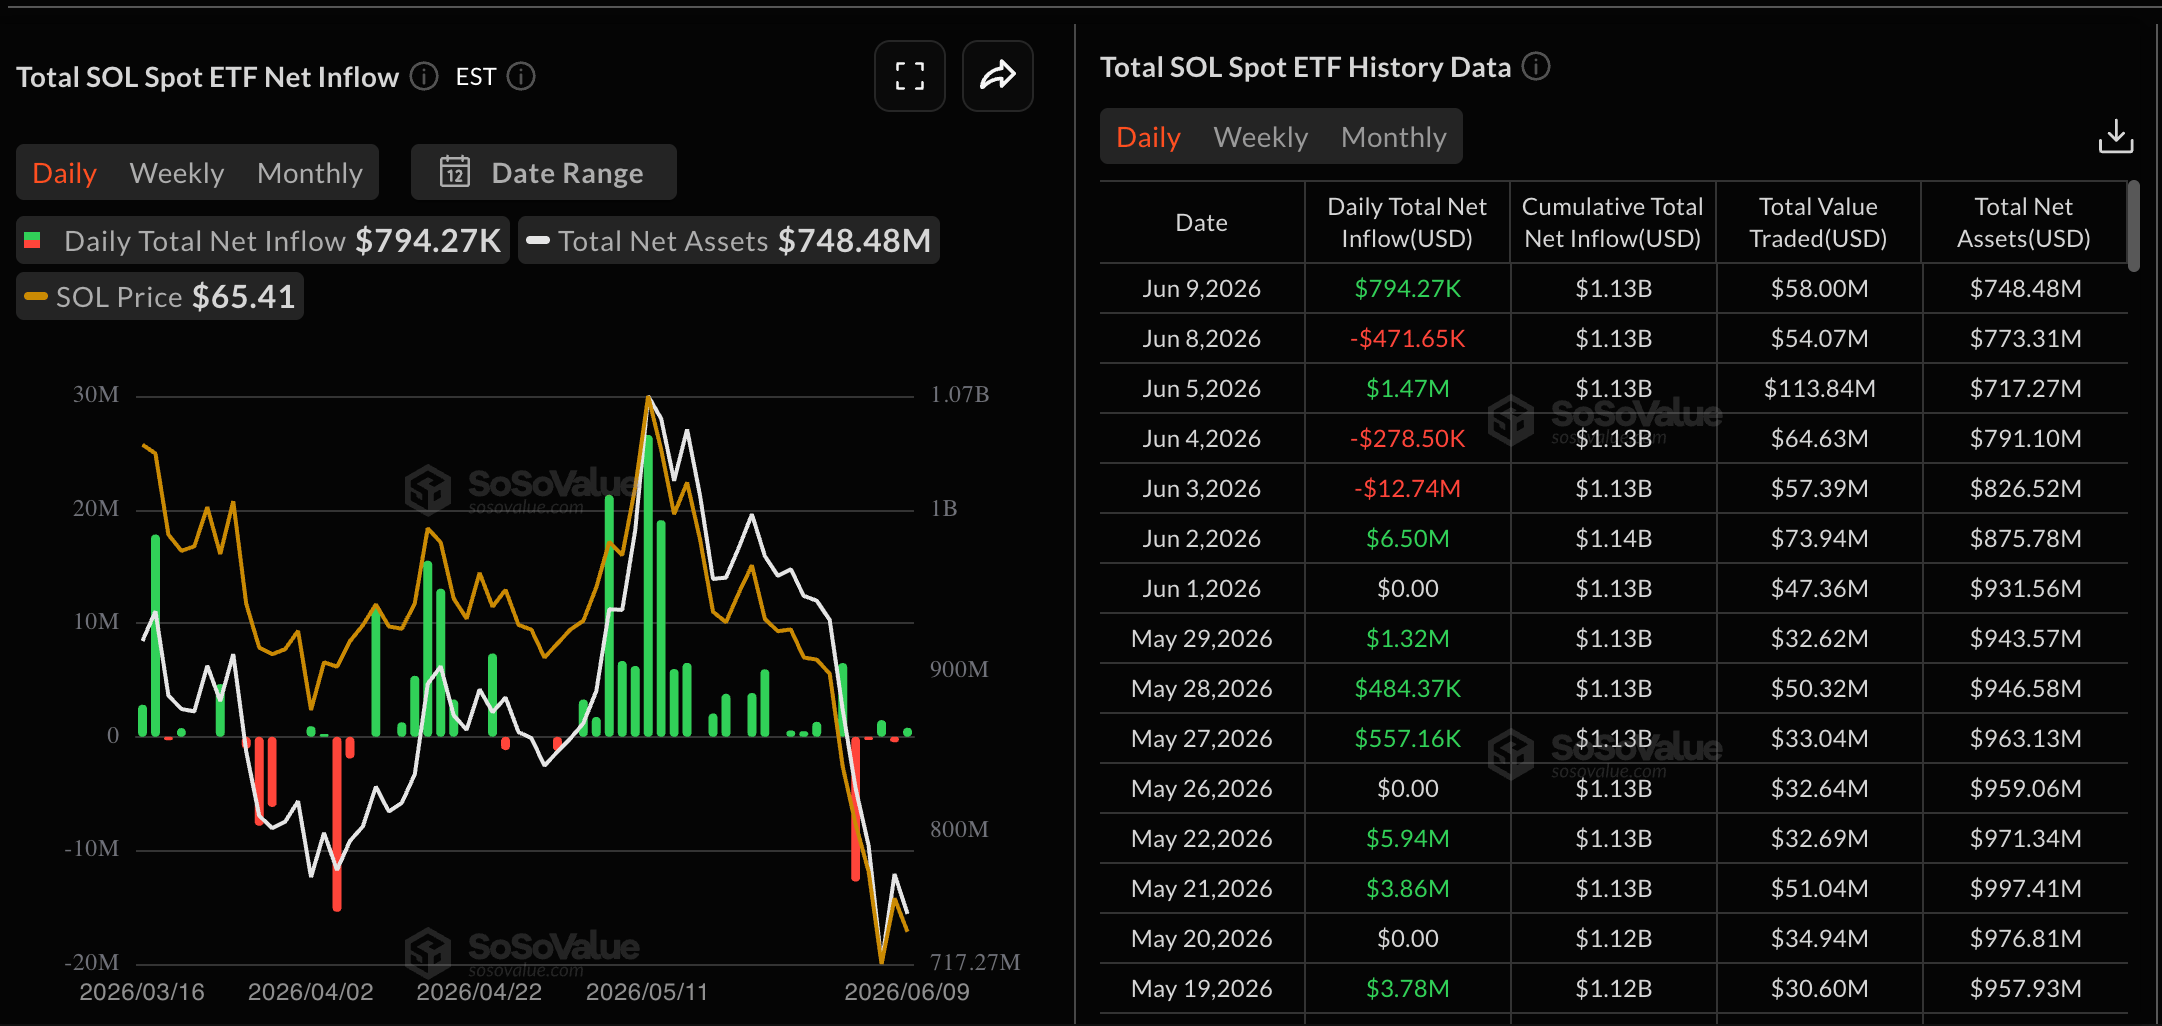
- SOL ETFs recorded $794,270 in inflows on Tuesday amid mixed institutional interest after about $6.52 million outflow last week.
- Derivatives data signal weak retail interest in Solana, as Open Interest declines amid near-zero funding rates.

Solana (SOL) is trading in the red below $65 on Wednesday as the broader cryptocurrency market remains under pressure. Mixed institutional demand for SOL and weak retail interest weigh on Solana, risking a steeper correction below $60.
Institutional and retail outlook on Solana gets heavier
Solana is losing interest from the institutional and retail spaces as the broader cryptocurrency market comes under pressure amid Bitcoin’s decline below $60,000. Data shows SOL-focused Exchange Traded Funds (ETFs) recorded $794,270 in inflows on Tuesday following $471,650 in outflows the previous day. Mixed ETF flows so far this week follow a $6.52 million weekly outflow in the previous one, suggesting mixed institutional sentiment toward Solana.
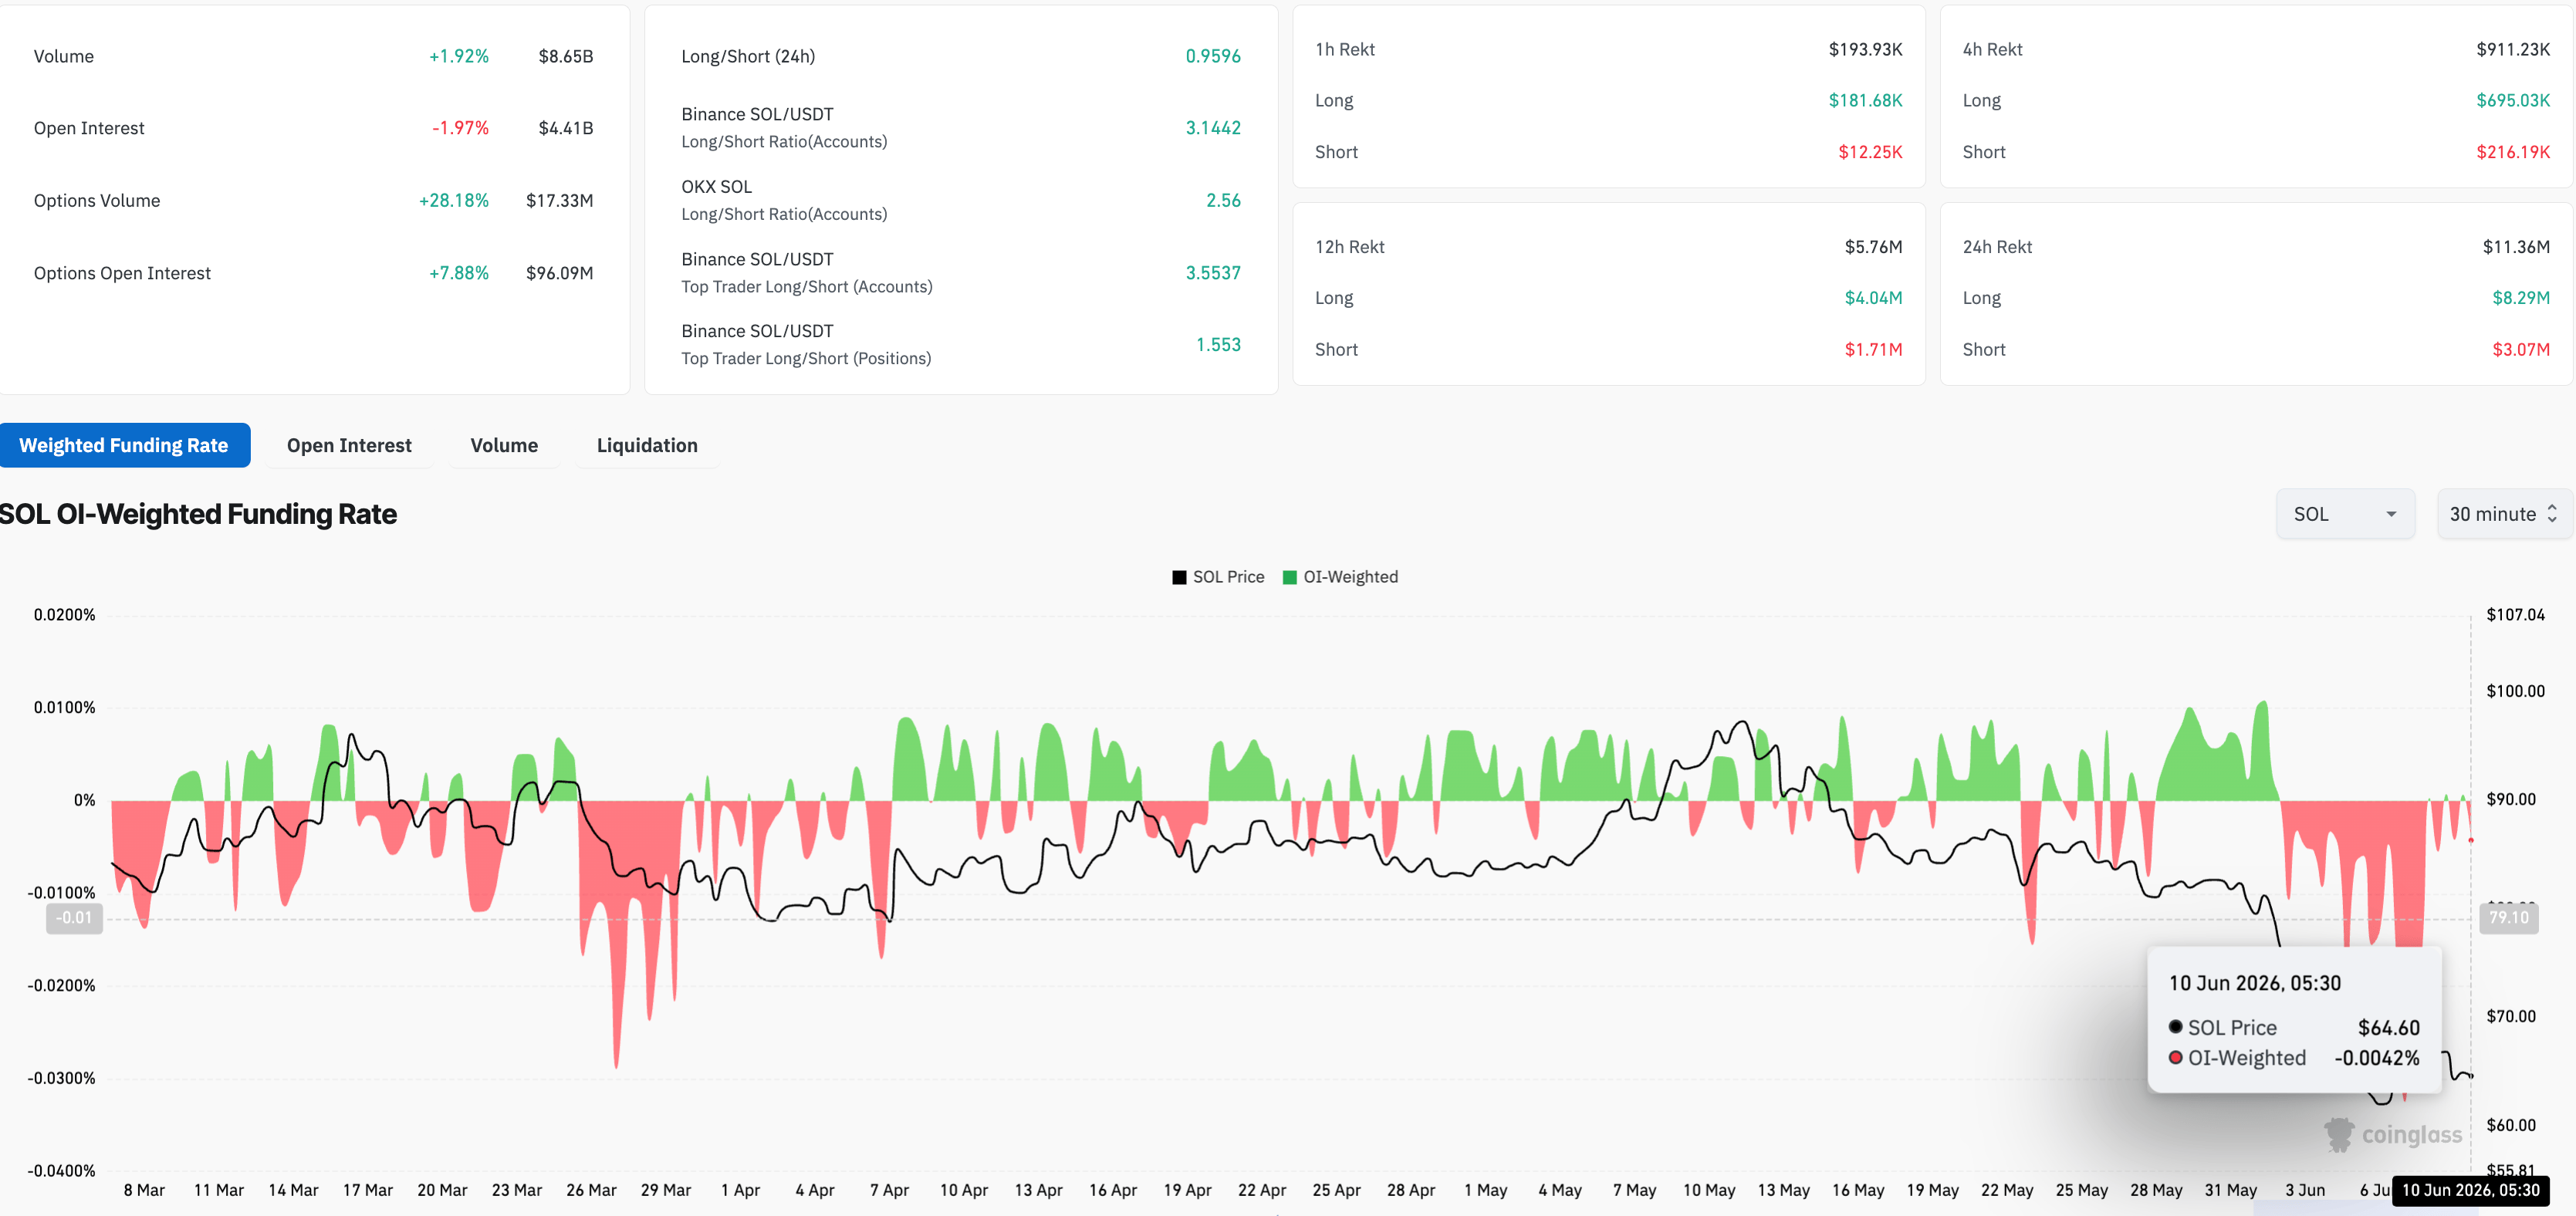
On the other hand, retail interest weakens in Solana derivatives. CoinGlass data show that SOL futures Open Interest (OI) is down roughly 2% over the last 24 hours to $4.41 billion, indicating a decline in the notional value of leveraged positions. At the same time, negative funding rates, which indicate bearish investor sentiment, have eased to -0.0042% from 0.0325% on Sunday, suggesting that leverage-driven selling pressure has softened.
Still, the $11.36 million in total liquidation over the last 24 hours, led by $8.29 million in long liquidations, reflects a broader weakness in bullish demand.
Could Solana absorb the pressure to hold above $60?
Solana trades around $64.19 at press time on Wednesday, well below the 50-, 100-, and 200-day Exponential Moving Averages (EMAs) at $80.25, $87.22, and $102.96, respectively, keeping a decisively bearish bias. From a technical perspective, Solana risks erasing the minor bounce from Sunday's $60.13 low, threatening the $59.11 support level, which is marked by the December 5, 2023, low.
That said, the Moving Average Convergence Divergence (MACD) remains deep in the negative territory on the daily chart. Still, Sunday's rebound narrowed the bearish MACD profile, while the Relative Strength Index (RSI) hovers around 26, suggesting oversold conditions that could slow but not yet reverse the prevailing downtrend.
Looking down, if Solana slips below $59.11, it could decline toward the November 13, 2023, support level at $51.28, near the $50 psychological threshold.
A potential recovery above $67.50 could target the $75.63 level marked by the February 24 low, followed by the 50-day EMA near $80.25, ahead of the 100-day EMA at $87.25.
(The technical analysis of this story was written with the help of an AI tool.)
(This story was corrected on June 10 at 08:00 GMT to say in the second bullet that SOL ETFs recorded $6.52 million in outflows last week, instead of $.692 million.)
Crypto ETF FAQs
An Exchange-Traded Fund (ETF) is an investment vehicle or an index that tracks the price of an underlying asset. ETFs can not only track a single asset, but a group of assets and sectors. For example, a Bitcoin ETF tracks Bitcoin’s price. ETF is a tool used by investors to gain exposure to a certain asset.
Yes. The first Bitcoin futures ETF in the US was approved by the US Securities & Exchange Commission in October 2021. A total of seven Bitcoin futures ETFs have been approved, with more than 20 still waiting for the regulator’s permission. The SEC says that the cryptocurrency industry is new and subject to manipulation, which is why it has been delaying crypto-related futures ETFs for the last few years.
Yes. The SEC approved in January 2024 the listing and trading of several Bitcoin spot Exchange-Traded Funds, opening the door to institutional capital and mainstream investors to trade the main crypto currency. The decision was hailed by the industry as a game changer.
The main advantage of crypto ETFs is the possibility of gaining exposure to a cryptocurrency without ownership, reducing the risk and cost of holding the asset. Other pros are a lower learning curve and higher security for investors since ETFs take charge of securing the underlying asset holdings. As for the main drawbacks, the main one is that as an investor you can’t have direct ownership of the asset, or, as they say in crypto, “not your keys, not your coins.” Other disadvantages are higher costs associated with holding crypto since ETFs charge fees for active management. Finally, even though investing in ETFs reduces the risk of holding an asset, price swings in the underlying cryptocurrency are likely to be reflected in the investment vehicle too.
Author

Vishal Dixit
FXStreet
Vishal Dixit holds a B.Sc. in Chemistry from Wilson College but found his true calling in the world of crypto.


