Top 3 Price Prediction Bitcoin, Ether, Ripple: BTC/USD fades and challenges Altcoins to take leadership
- Dominance charts show a positive spin for Ether to the detriment of Bitcoin.
- The technical structures also favour the project led by Vitalik Buterin.
- XRP, the token of Ripple Ltd, fights to regain the $0.20 level and position itself in the race to the moon.

After a one-day break in the cryptocurrency market, the transfer of market share between Bitcoin and a large part of the Altcoin segment has resumed.
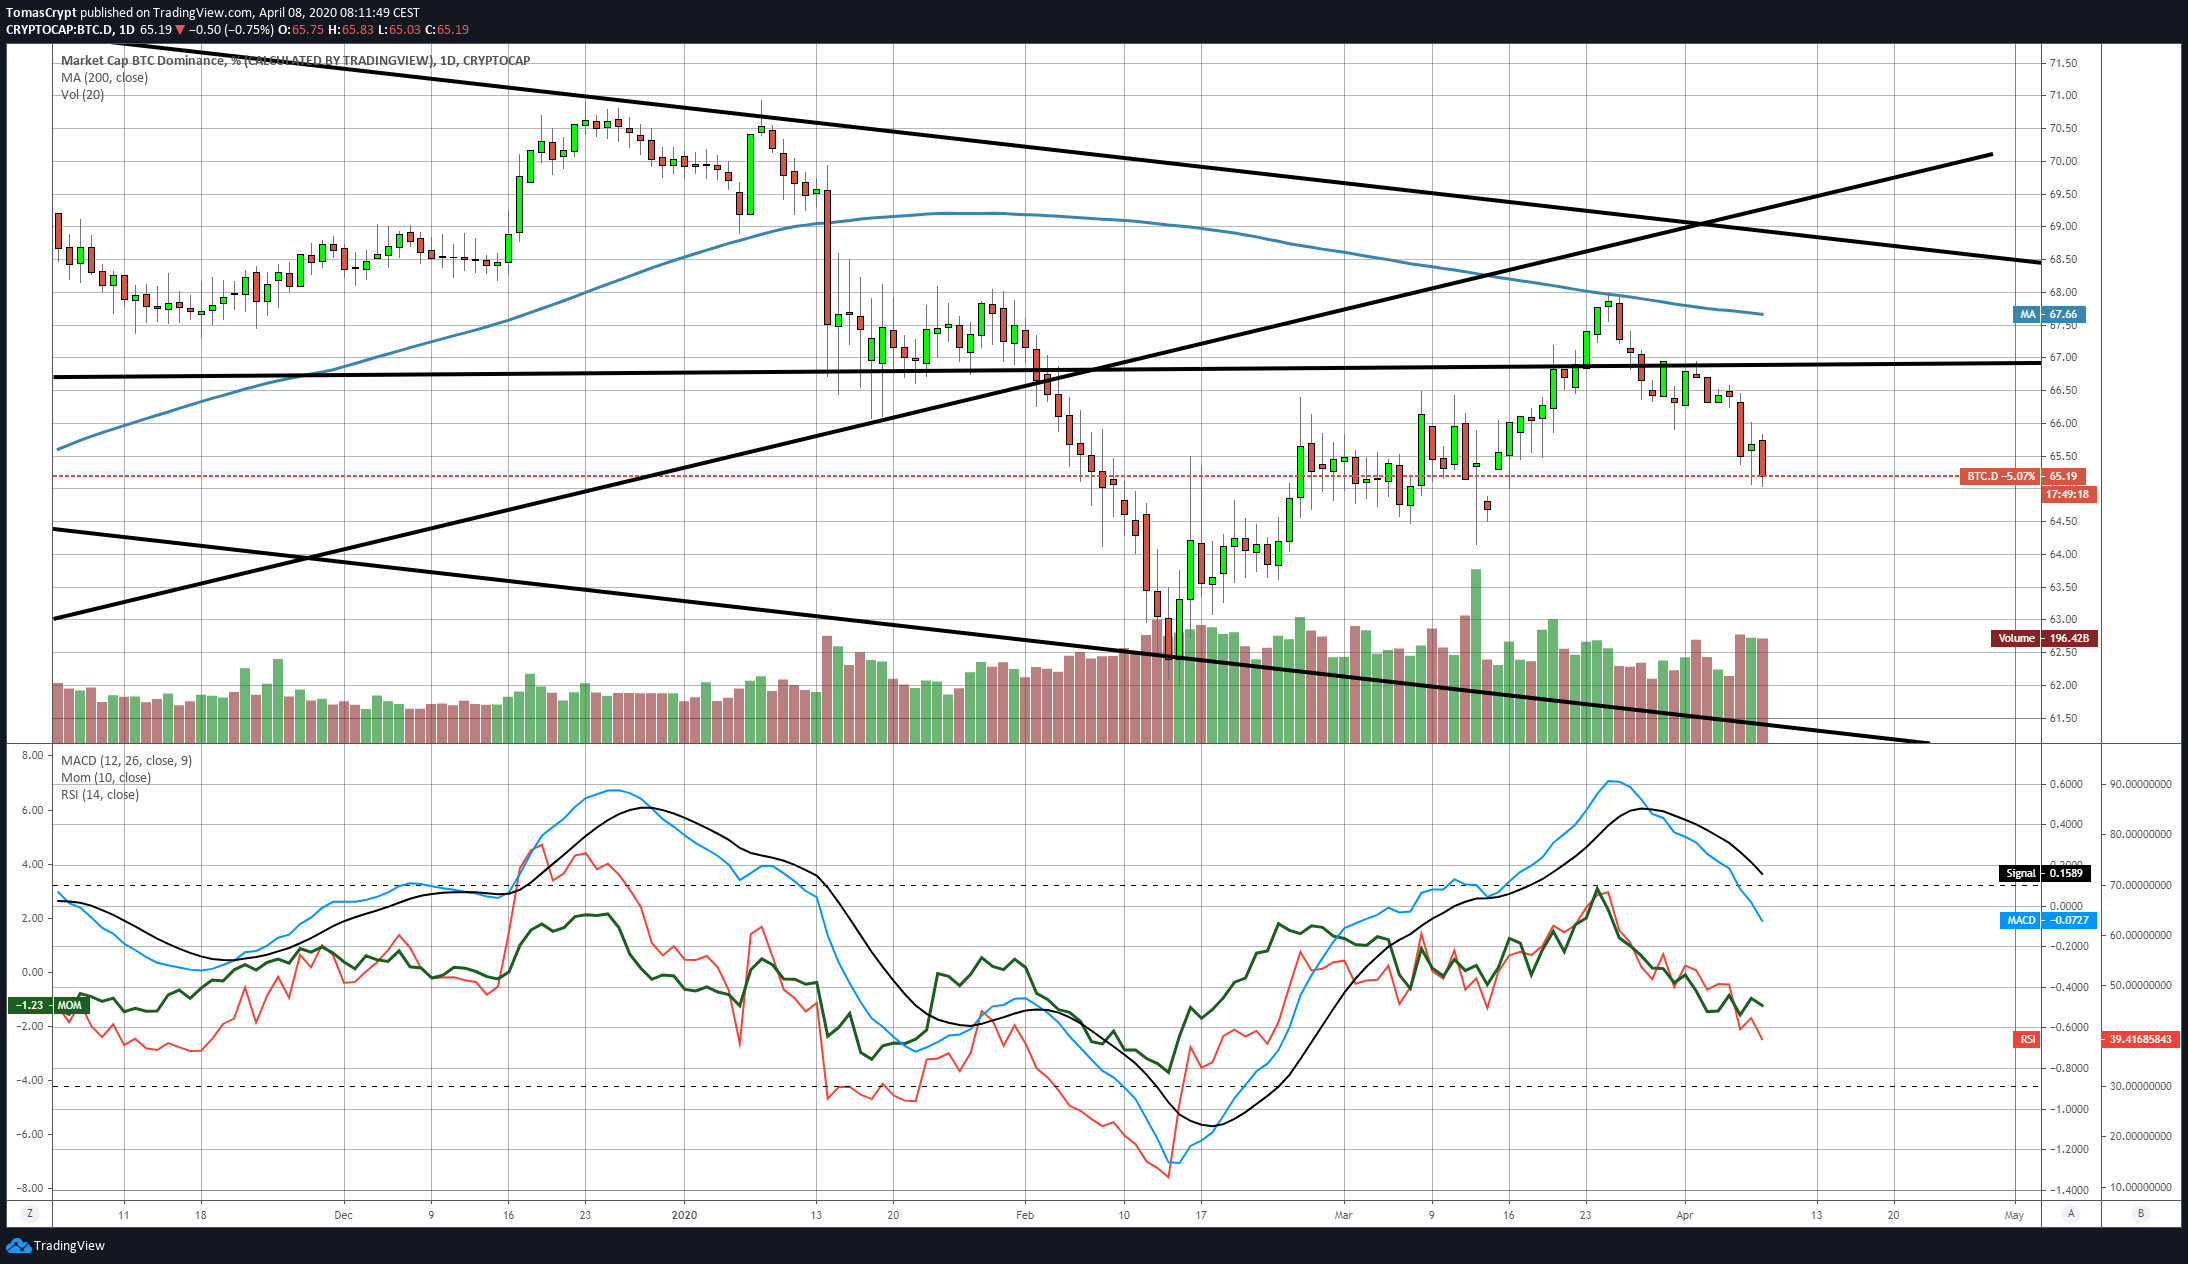
The Bitcoin dominance chart shows an acceleration in the downward trend that started last March 25. The current bearish target points to the 60 level, a level not seen since June 19, 2019.
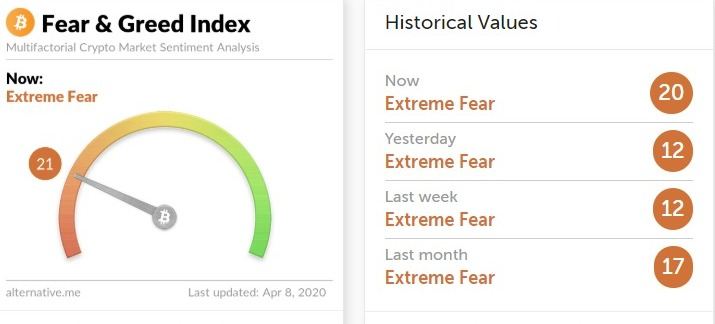
Market sentiment continues to improve and reaches level 21 now, according to the site alternative.me. This number is an "extreme fear" level, which gives an idea of the price expectations needed for this indicator to reach the opposite side of the emotional range.
ETH/BTC Daily Chart
ETH/BTC is currently trading at the price level of 0.0233 after confirming congestion support at 0.0228.
The main moving averages increase their bullish profile, with the 50-day exponential moving average showing a significant improvement.
Above the current price, the first resistance level is at 0.0255, then the second at 0.0268 and the third one at 0.0275.
Below the current price, the first support level is at 0.0228, then the second at 0.0223 and the third one at 0.022.
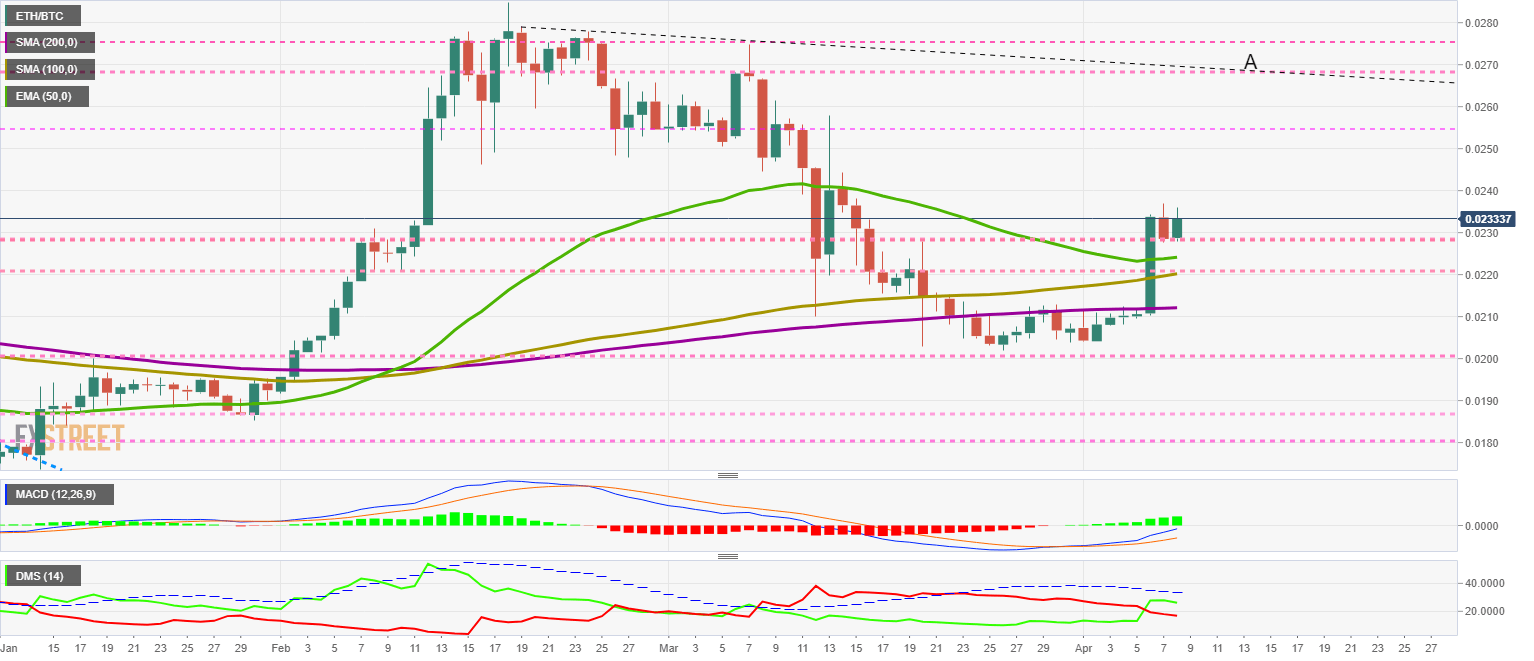
The MACD on the daily chart continues to improve the bullish structure, although the excessive line separation at such an early stage may lead to price reversals and volatility.
The DMI shows that the bulls are losing momentum, although as the bears are also moving lower, it seems more a matter of timing than a change in the correlation of forces.
BTC/USD Daily Chart
The BTC/USD pair is currently trading at the price level of $7330 and confirms support in the long-term downward sloping channel ceiling. The main moving averages show a mixed position, with the 50-day Exponential Average curving higher while the 100-day and 200-day Simple Averages holding the downward trend at around $8250.
Above the current price, the first resistance level is at $7450, then the second at $7600 and the third one at $7750.
Below the current price, the first support level is at $7150, then the second at $6870 and the third one at $6600.
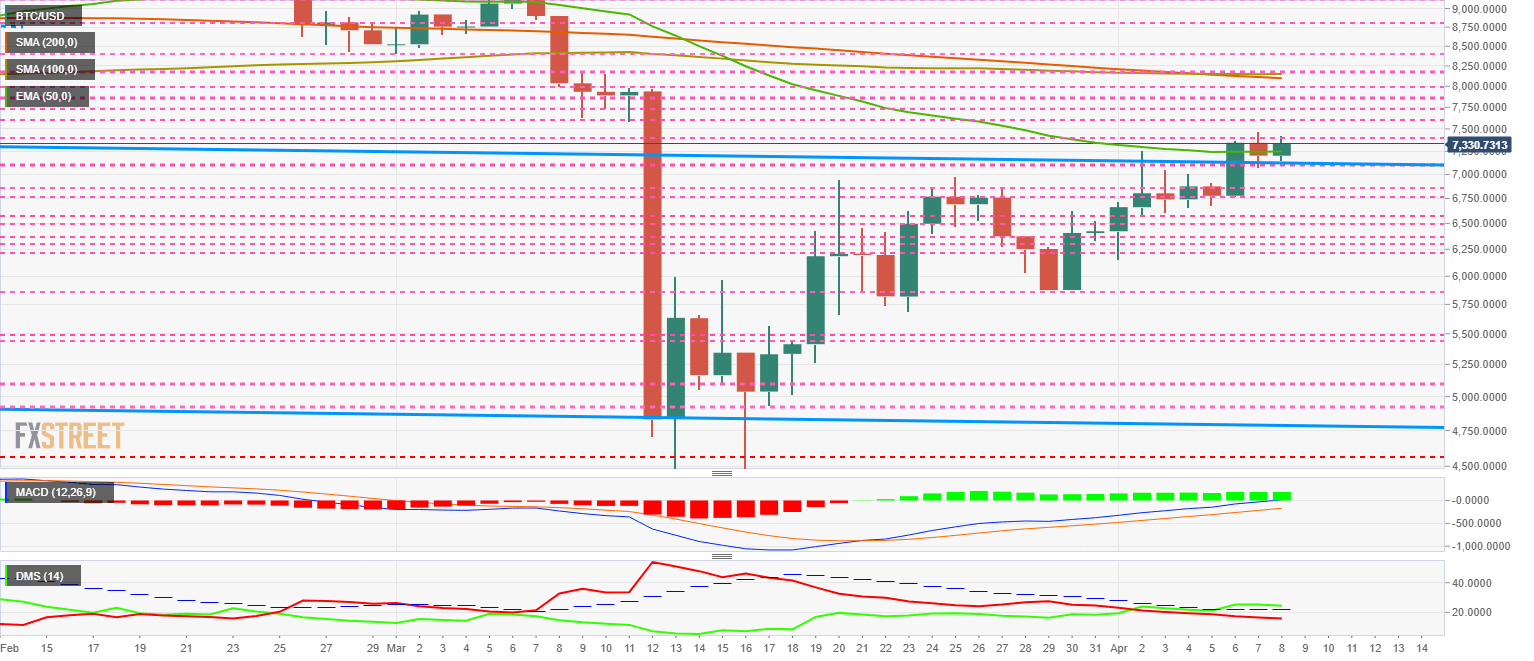
The MACD on the daily chart reaches the zero level, which always carries a resistance for the trend to develop. The slope and opening are strongly bullish, although it is very likely that it will lose slope and opening in the next few hours.
The DMI on the daily chart shows that the bulls are losing their upward momentum and are moving downward to find support at the ADX line, from where they may bounce back upwards. The bears continue to lose strength and are driving below 20 levels.
ETH/USD Daily Chart
The ETH/USD pair is currently trading at $171.2 and copies the figure already seen in the ETH/BTC pair. The price of the Ether is compressed between the 50-day Exponential Moving Average - acting as support - and the 200-day Simple Moving Average - acting as resistance.
The main moving averages on the ETH/USD chart point slightly upwards, in contrast to the BTC/USD one.
Above the current price, the first resistance level is at $173, then the second at $180 and the third one at $190.
Below the current price, the first support level is at $164, then the second at $160 and the third one at $155.
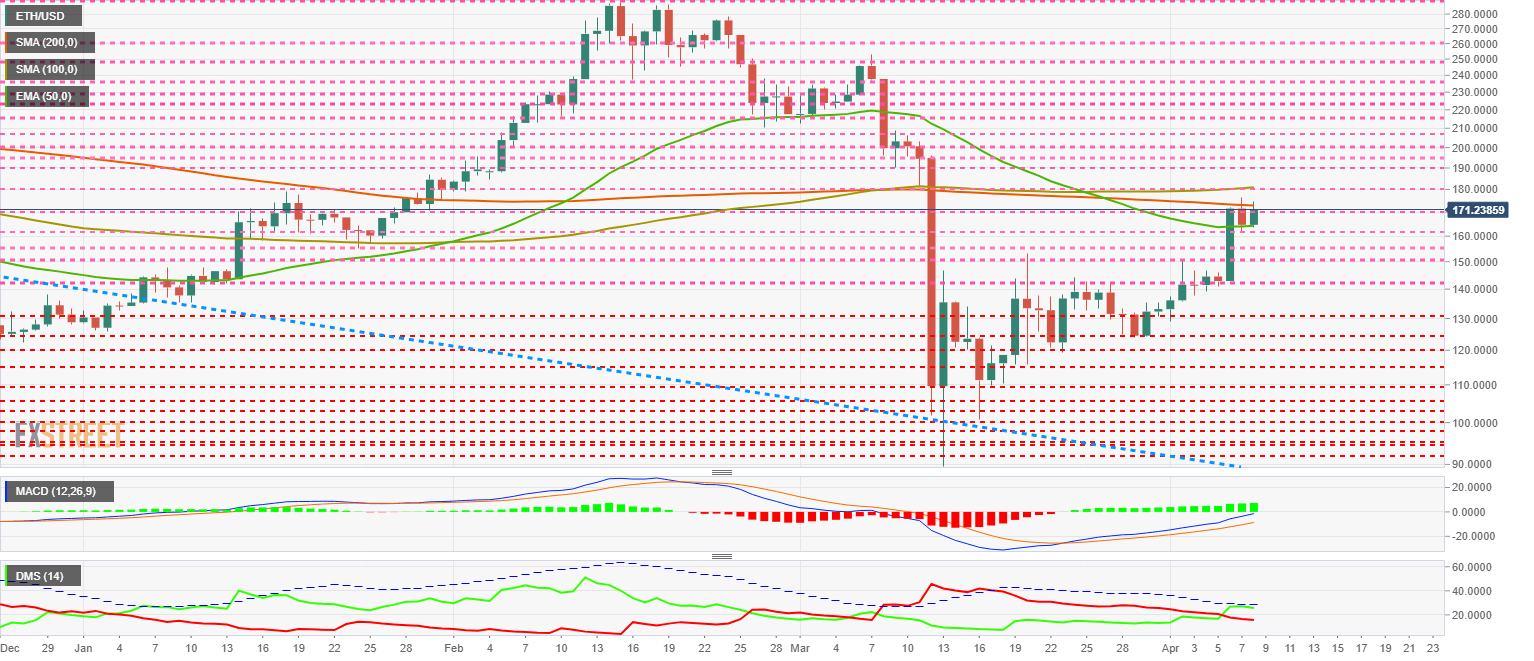
The MACD on the daily chart has reached the 0 levels, increasing the probability to appears resistance in the coming hours. The slope and openness between the lines preserve a strong upward profile.
The DMI on the daily chart shows that the presence of the ADX line limits the bulls. The bearish move continues with the bearish momentum and the pair is now trading below the 20 levels.
XRP/USD Daily Chart
The XRP/USD pair is trading at $0.1999 and is struggling to conquer the resistance level at $0.20.
The main moving averages show a flat profile, except for the 200-day Simple Moving Average which remains in a downtrend.
Above the current price, the first resistance level is at the price level of $0.20, then the second at $0.217 and the third one at $0.236.
Below the current price, the first support level is at $0.19, then the second at $0.179 and the third one at $0.171.
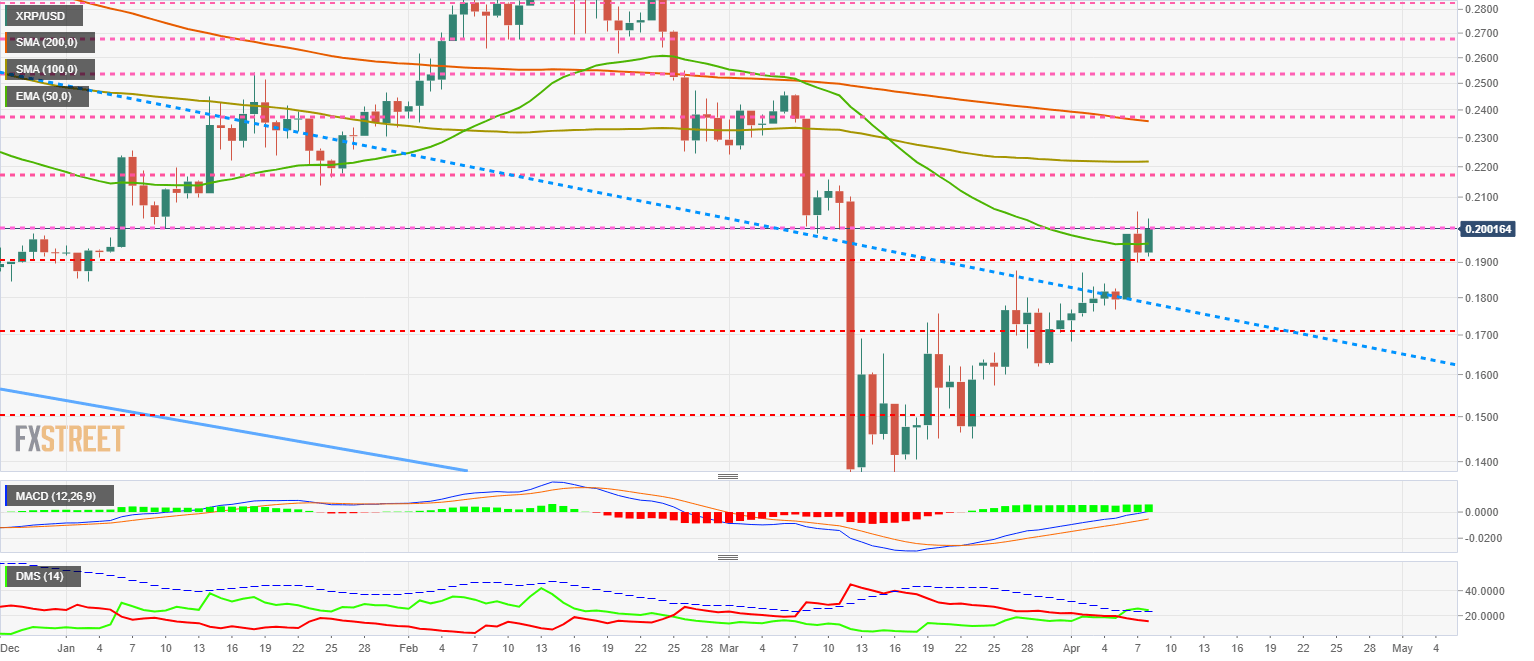
The MACD on the daily chart has reached the 0 levels of the indicator, which is a barrier to bullish development. The opening and tilting between the indicator's lines preserve the bullish configuration.
The DMI on the daily chart shows how the bulls are moving above the ADX line but losing bullish momentum and looking for support in the trend indicator – the ADX. Bears continue to lose strength smoothly.
Get 24/7 Crypto updates in our social media channels: Give us a follow at @FXSCrypto and our FXStreet Crypto Trading Telegram channel
Author

Tomas Salles
FXStreet
Tomàs Sallés was born in Barcelona in 1972, he is a certified technical analyst after having completing specialized courses in Spain and Switzerland. He expanded his technical training following the guidance of great experts on the financial markets.


