Top 3 Bitcoin, Ethereum and Ripple Price Predictions: what goes up must come down - Confluence Levels
- BTC/USD recovers from recent lows, but the upside is limited.
- ETH/USD capped by strong resistance area.
- XRP/USD gained 3.5%, but bulls seem to be exhausted.

Bitcoin and all major altcoins are recovering from the lows reached during Wednesday trading. Considering the deeply oversold stance of cryptocurrency market that lost $50B of its total value in a week's time, the upside qualifies for a healthy correction. The news that another Swiss Bank opened its doors to clients with digital assets and positive comments from crypto influencers acted as an extra incentive.
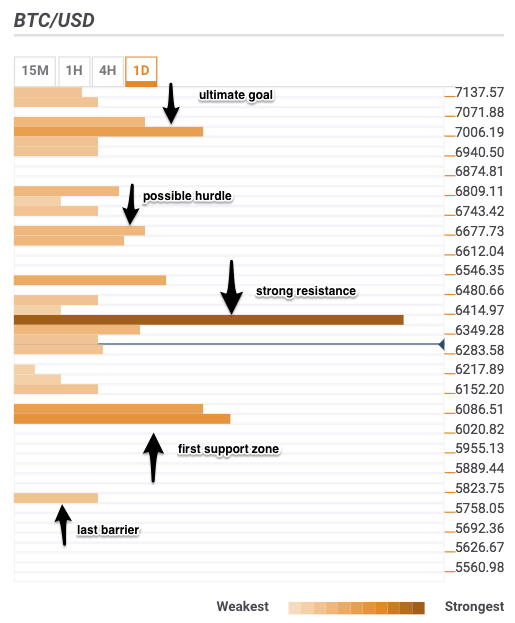
BTC/USD 1D
BTCUSD is changing hands at $6,322, off Wednesday's low reached at $6,121; The coin gained about 1% since the start of the day, but it is still 2.7% down on a daily basis. The nascent recovery may be short-lived unless the bulls are bold enough to drag the price above $6,400. This resistance area is guarded by a confluence of technical indicators, which includes 38.2% Fibonacci retracement daily, one-hour high., SMA100 - 15 min, Bollinger Band 15min - Upper and Pivot Point one month Support 1.
Above $6,400 the recovery may be stopped by 61.8% Fibonacci retracement, SMA10 - 4hour and Bollinger Band 1-hour - Upper. Stronger resistance area is registered on approach to $7,000 with 61.8% Fibonacci retracement monthly located close to this handle.
There is not much in terms of support levels below the current price, which makes the downside an easier choice. Pivot Point one-week Support 3. Pivot Point one day Support 1б and last month low under $6,100 handle are likely to stop the downside, though, once this area is cleared, the sell-off may be extended towards Pivot Point one day Support 2 at $5,750.
Get 24/7 Crypto updates in our social media channels: Give us a follow at @FXSCrypto and our FXStreet Crypto Trading Telegram channel
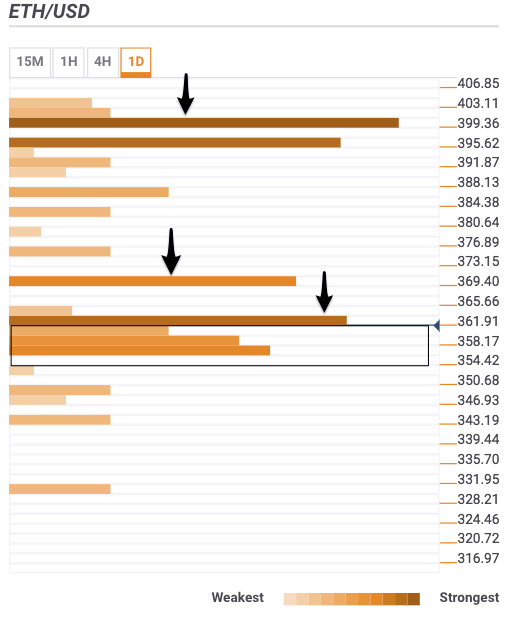
ETH/USD 1D
The second digital coin by market capitalization is trading at $360, down 2.1% on a daily basis and up 1.4% since the beginning of Thursday. The price is trapped in a narrow range, as strong resistance area above the current price won't let it higher, while a confluence of support lines stop the downside.
Below the current price, there is a cluster of technical levels, including: 4-hour low, Bollinger Band 15-min - Lower, Bollinger Band 1-hour - Middle, SMA50 - 1-hour, one hour low, SMA10 - 1-hour, 15 min low, SMA5 - 15 min, Pivot Point one-week Support 2, Pivot Point one-month Support 2 and 23.6% Fibonacci retracement daily. A sustainable movement below will open up the way to $330 with Pivot Point one-day Support 2.
A confluence of various technical indicators right above the current price includes 15-min high, 38.2% Fibonacci retracement daily, SMA10 - 15 min, SMA5 - one hour, Bollinger Band 15 min - Middle, SMA5 - 4-hour, SMA100 - 15 min, one hour high.
Bollinger Band 1-day - Lower, 61.8% Fibonacci retracement daily, SMA10 - 4hour and Bollinger Band 1-hour - Upper are located on at $370, while the next resistance zone is spotted on approach to $400. This is considered to be the ultimate goal for the bulls, though a confluence of strong levels makes it hard to clear. The levels include:
The last month low and last week low, Pivot Point one-day Resistance 2, Pivot Point one-month Support 1.
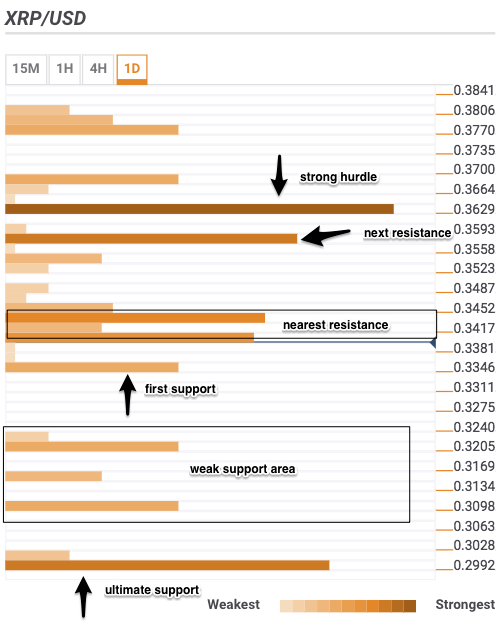
XRP/USD 15
XRP managed to gain 3.5% since the start of the day, recovering from the multi-month low reached at $0.3200. The coin is still 2.5% down on a daily basis, while the upside momentum is losing traction ahead of strong resistance area, created by a confluence of technical indicators, including Bollinger Band 1-hour - Middle, 4-hour high, SMA50 - 15 min, SMA5 - 4hour, SMA5 - 15 min, 38.2% Fibonacci retracement daily.
The next strong resistance is created on approach to $0.3600 by Bollinger Band 4-hour - Upper, 4-hour high and 61.8% Fibonacci retracement daily. Pivot Point one-month Support 2 comes above $0.3630.
Below the current price, there are few technically important levels with 23.6% Fibonacci retracement daily above $0.3350 and one-day low at $0.3205. If these supports are cleared, the downside may be extended towards Pivot Point one-month Support 3 located under $0.3000.
Author

Tanya Abrosimova
Independent Analyst


