- Bitcoin price has rallied 8% so far after an explosive start to 2023.
- A flip of the 200-weekly SMA at $24,646 will open the path for BTC to retest $30,000.
- Invalidation of the bullish thesis will occur if BTC flips the $15,443 support level.
Bitcoin price has begun its ascent after a steep bear market correction. This massive upswing began after a fresh start to 2023, but things could get interesting if BTC can flip a certain level into a support floor.
Also Read: Bitcoin Weekly Forecast: Assessing shift in BTC’s narrative and critical levels to watch
Bitcoin price oozes bullishness
Bitcoin price has shed 77% from its all-time high of $69,000. This downtrend was a result of investors booking profits combined with the collapse of key players in the industry in a feedback loop.
Each move kept adding more pressure to the industry participants, causing them to crumble and file for bankruptcy, which added more pressure on the Bitcoin price to slide lower.
Regardless, 2023 had a good start as BTC is up roughly 36% so far, with an 8% rally overnight that has pushed Bitcoin price above a critical hurdle at $21,383. This development now puts the bulls against one major blockade.
This resistance level is a confluence of the horizontal barrier at $23,384 and the 200-week Simple Moving Average (SMA) at $24,645. The last time Bitcoin price slipped below this SMA was in June 2022 and briefly in March 2020.
An interesting observation to make here is that in its 12-year history, Bitcoin has never stayed below this support level for a prolonged duration. Therefore, bulls are likely going to target this hurdle next.
A successful flip of this confluence, especially the $24,645 into a support floor on a weekly timeframe, will open the path for Bitcoin price to retest the $30,000 hurdle.
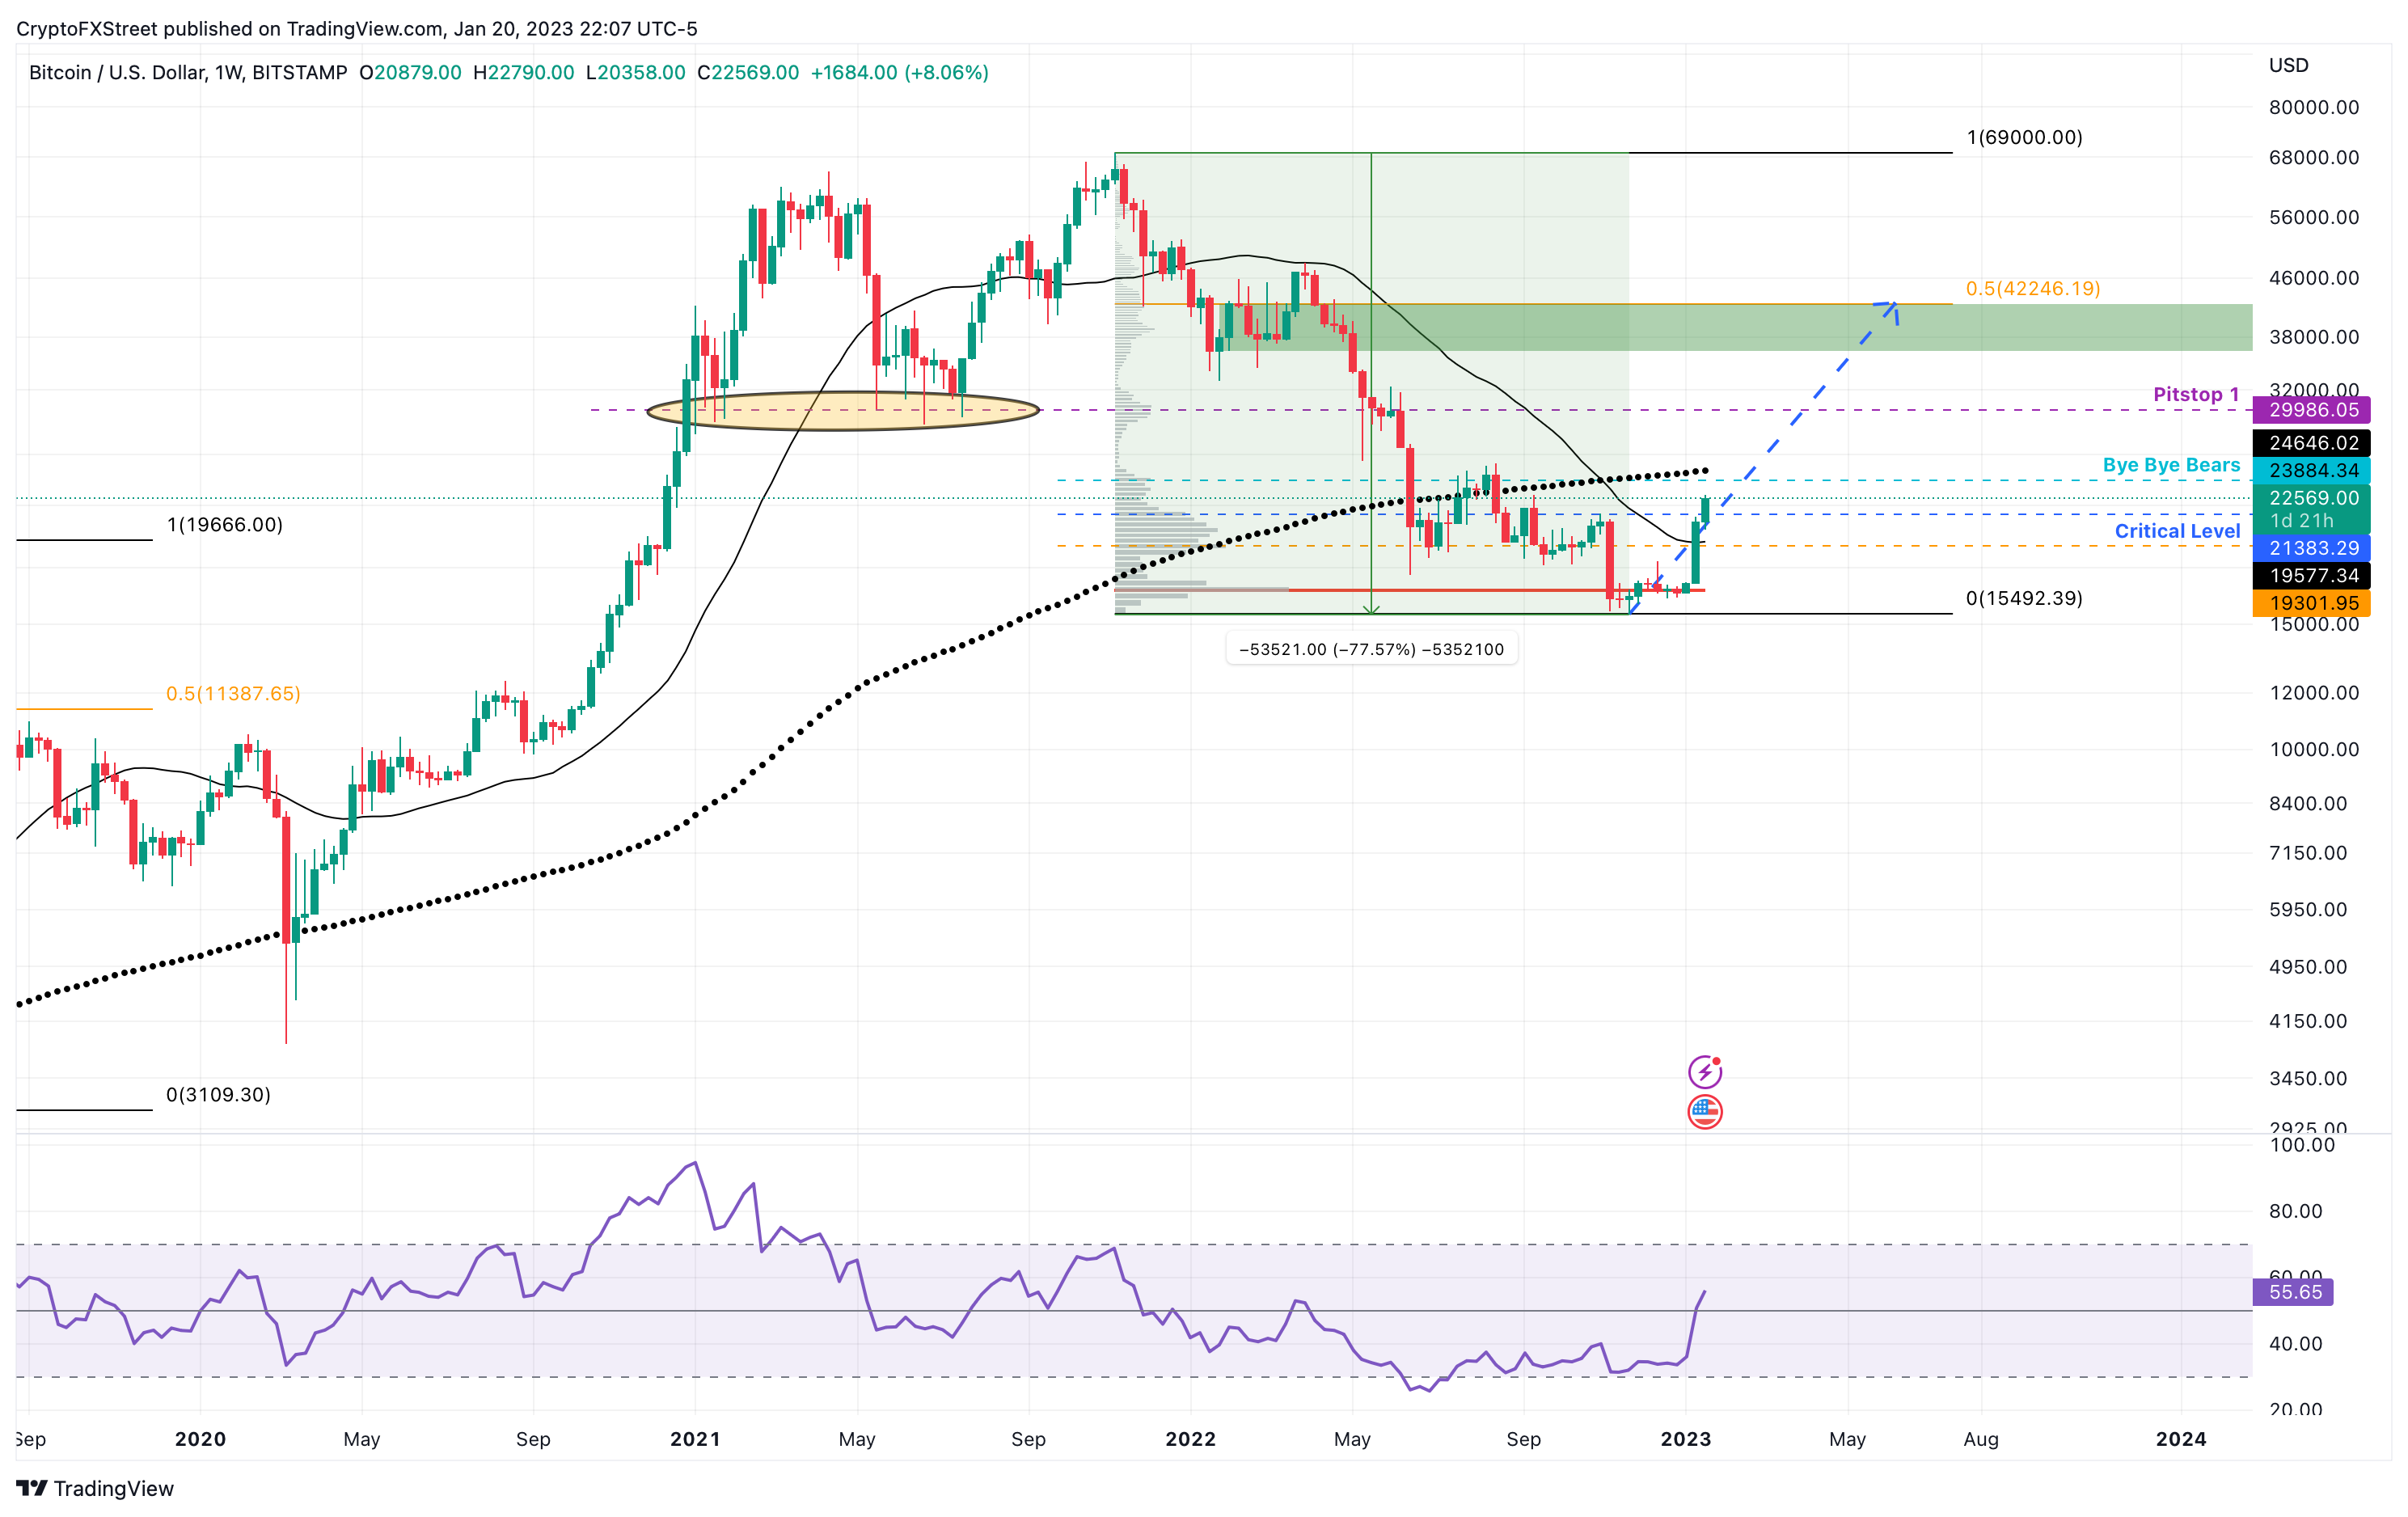
BTC/USDT 1-week chart
While things are looking up for Bitcoin price, this is the first time in the 12-year history BTC has stayed below the 200-week SMA for more than two weeks. But since the 2022 bear market has pushed the big crypto below this level at $24,645, it is a significant move from a macro perspective that investors need to be cautious about.
Although the bullish outlook seems unfadeable, a rejection at a 200-week SMA at $24,645 will be a crucial sign for bears. A secondary confirmation of the bearish outlook will occur on the breakdown of the $19,301 support level.
A weekly candlestick close, however, below the $15,443 level will create a lower low and invalidate the bullish thesis. In such a case, Bitcoin price could slide as low as $11,387.
Information on these pages contains forward-looking statements that involve risks and uncertainties. Markets and instruments profiled on this page are for informational purposes only and should not in any way come across as a recommendation to buy or sell in these assets. You should do your own thorough research before making any investment decisions. FXStreet does not in any way guarantee that this information is free from mistakes, errors, or material misstatements. It also does not guarantee that this information is of a timely nature. Investing in Open Markets involves a great deal of risk, including the loss of all or a portion of your investment, as well as emotional distress. All risks, losses and costs associated with investing, including total loss of principal, are your responsibility. The views and opinions expressed in this article are those of the authors and do not necessarily reflect the official policy or position of FXStreet nor its advertisers. The author will not be held responsible for information that is found at the end of links posted on this page.
If not otherwise explicitly mentioned in the body of the article, at the time of writing, the author has no position in any stock mentioned in this article and no business relationship with any company mentioned. The author has not received compensation for writing this article, other than from FXStreet.
FXStreet and the author do not provide personalized recommendations. The author makes no representations as to the accuracy, completeness, or suitability of this information. FXStreet and the author will not be liable for any errors, omissions or any losses, injuries or damages arising from this information and its display or use. Errors and omissions excepted.
The author and FXStreet are not registered investment advisors and nothing in this article is intended to be investment advice.
Recommended Content
Editors’ Picks
Avalanche Network introduces Firewood upgrade amid declining on-chain activity, AVAX holders uncertain

Avalanche introduces Firewood as an efficient blockchain database system. The smart chain platform notes a decline in several key metrics like active addresses, revenue and fees generated.
Ripple price could hit $0.66 as market mood improves, XRP analyst says

XRP price broke a key resistance level, with analysts anticipating a potential target of $0.66. Ripple is just above the critical level of $0.50, anticipating buying activity after a stagnant September.
Chainlink price still trapped in range despite exhausted macro downtrend

Chainlink (LINK) price is cooking up a recovery rally after exhausting consolidation beneath a macro descending trendline. However, it remains confined within a range in the weekly timeframe, but an opportunity for breaking out could present soon.
Bitcoin SV price rises by 30% in a day as CEO resigns amid controversy

Bitcoin SV at the time of writing was well above $40, marking a two-month high. The volatility surrounding the altcoin is also on the rise and could negate the recent price rise.
Bitcoin: BTC recovery rally could be bull trap in disguise, here’s why

Bitcoin (BTC) price remains unfazed even after the multiple spot BTC ETF delays from the US Securities & Exchange Commission (SEC). But investors need to be careful with the ongoing BTC rally as it could be a trap for early bulls.