Theta price aims for a massive 22% upswing if key barrier cracks
- Theta price is trading inside a descending triangle pattern on the 1-hour chart.
- The digital asset faces just one critical resistance level ahead of the 22% breakout.
- Bears could still come back and drive the digital asset toward $10.

Theta price has been trading between a specific range in the past four days and awaits a clear breakout as it is close to the key resistance level of $12.
Theta price aims for a 22% jump toward $14.5
On the 1-hour chart, Theta has formed a descending triangle pattern which can be drawn by connecting the lower highs and flat lows with two trendlines that converge.
A 1-hour candlestick close above $12 would confirm a breakout that has a price target of $14.5, a potential 22% move calculated using the pattern’s initial height.
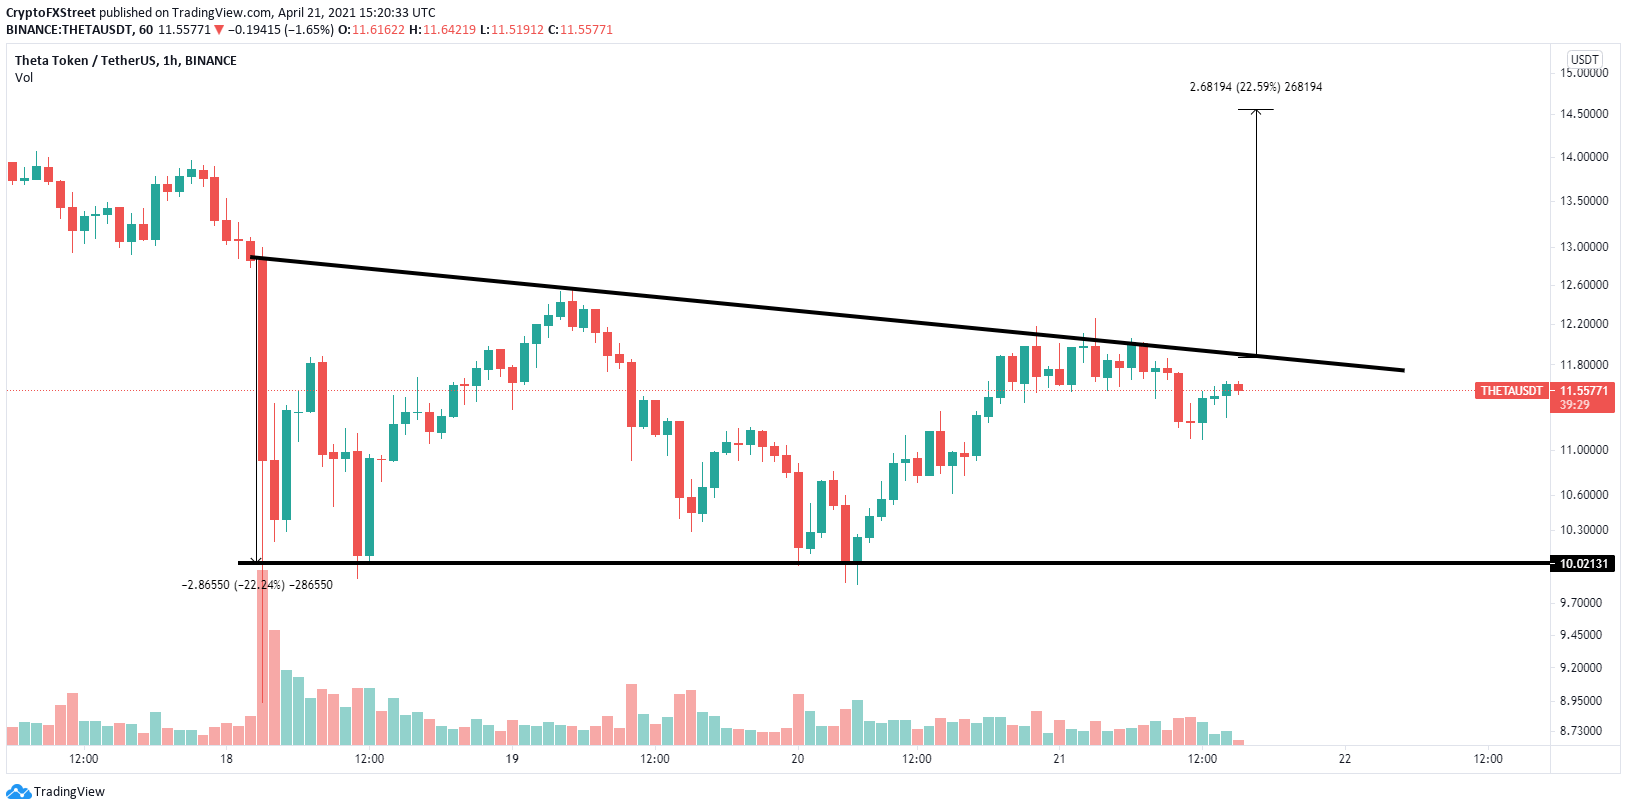
THETA/USD 1-hour chart
On the 12-hour chart, THETA has managed to stay above a key support trendline on the Relative Strenght Index (RSI) and is bouncing from it again, adding credence to the bullish outlook.
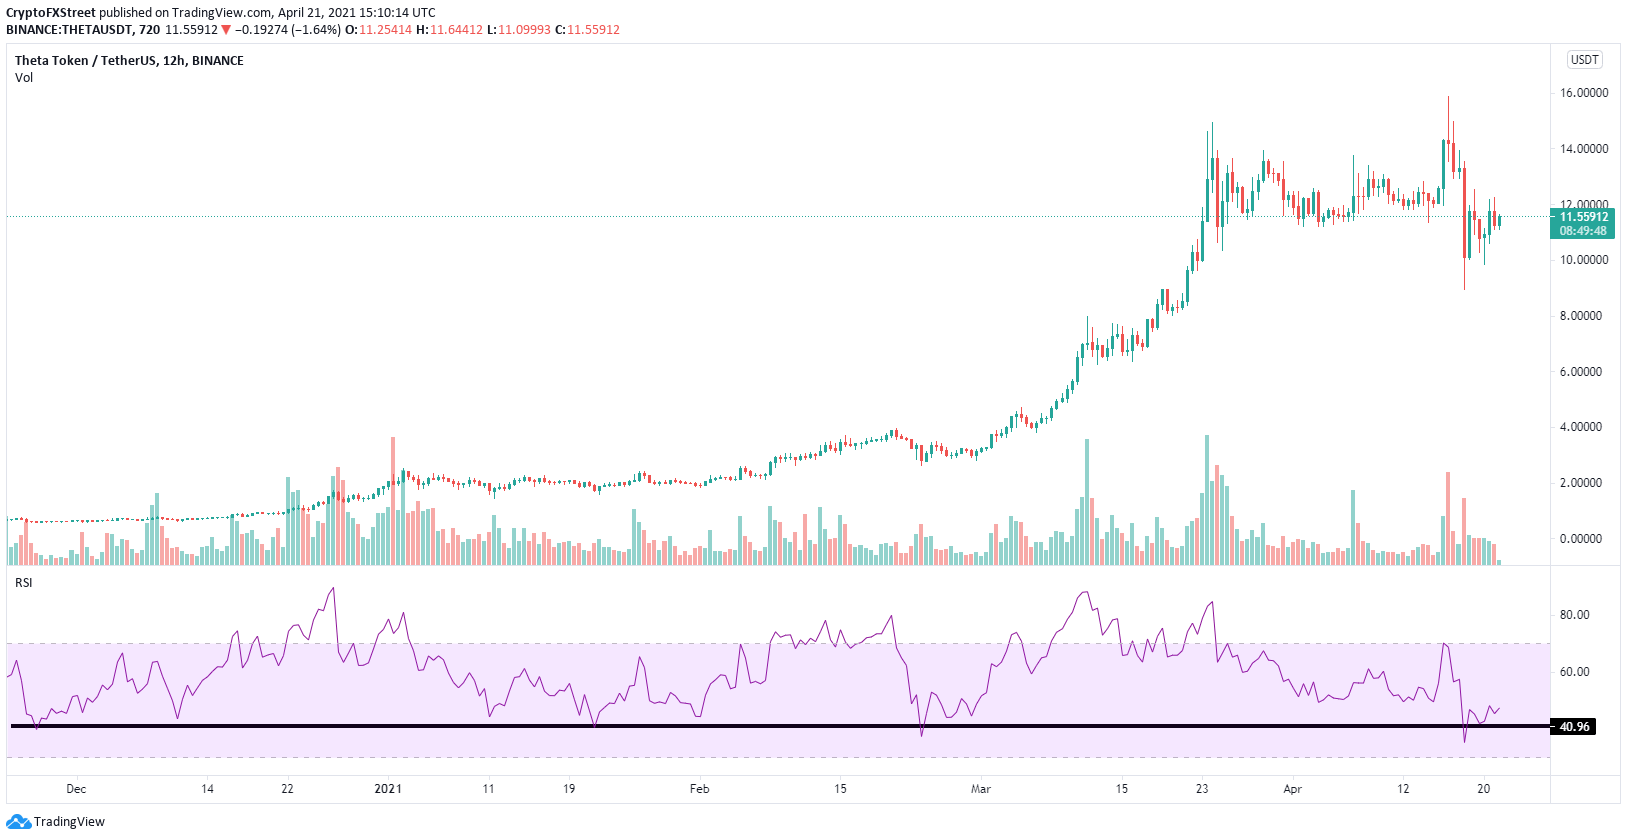
THETA/USD 12-hour chart
However, a rejection from the upper boundary of the descending triangle pattern on the 1-hour chart would be a significantly bearish signal.
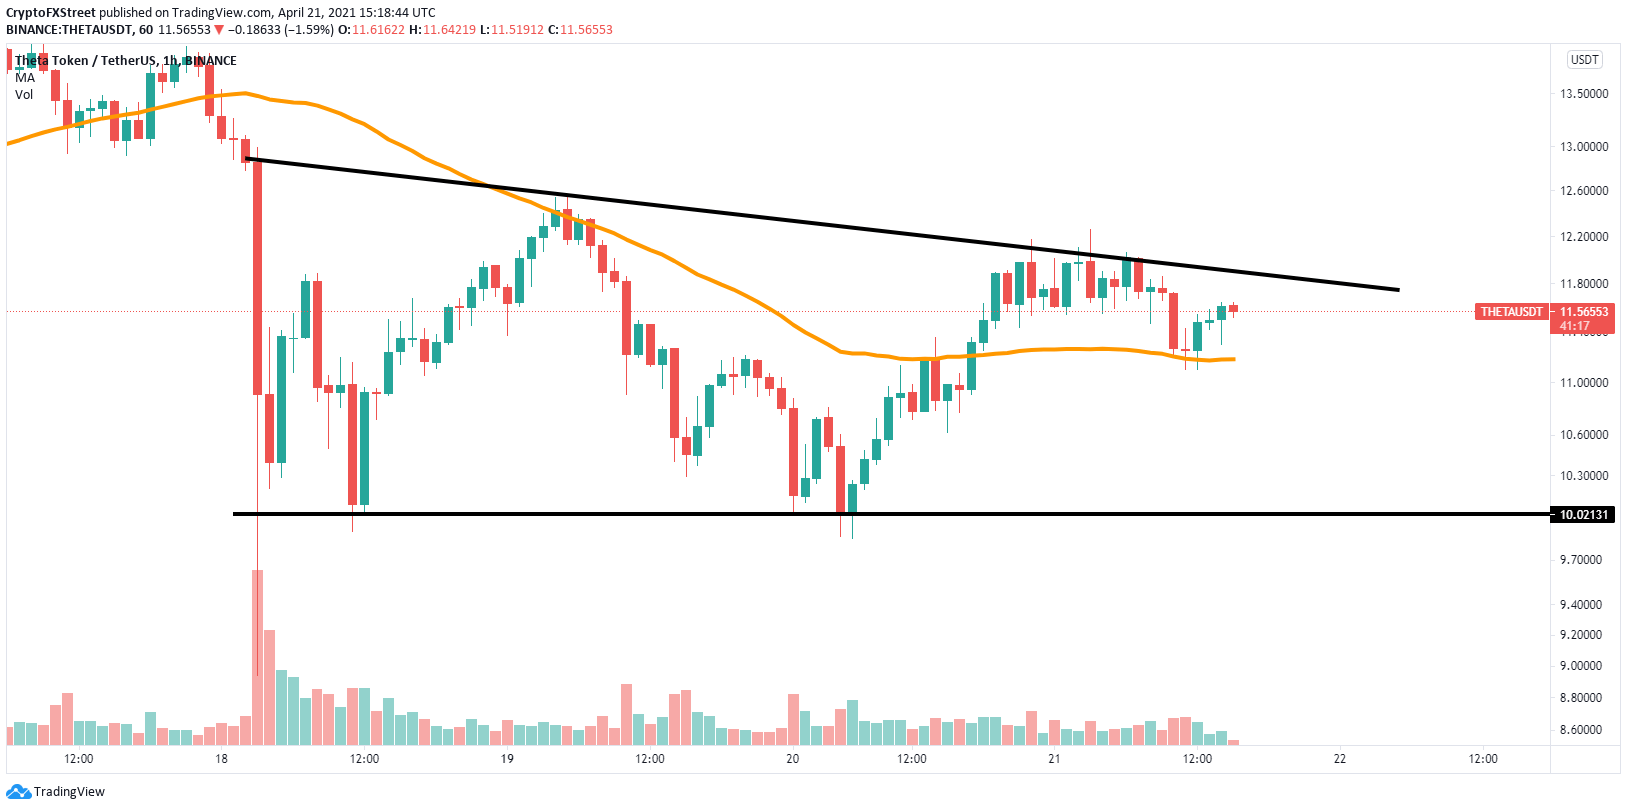
THETA/USD 1-hour chart
The most notable support level is the 50 SMA at $11.2. If this level cracks, THETA can quickly fall toward the lower end of the pattern located at the psychological level of $10.
Author

Lorenzo Stroe
Independent Analyst
Lorenzo is an experienced Technical Analyst and Content Writer who has been working in the cryptocurrency industry since 2012. He also has a passion for trading.


