Terra price headlines the new altcoin season, but LUNA may need to pullback
- Terra price prints a new all-time high after logging a 320% gain since July 21.
- LUNA is close to registering a bullish Golden Cross pattern as the 50-day simple moving average (SMA) approaches the 200-day SMA.
- LUNA social media dominance has not reached the readings printed back at the peak in March.

Terra price has quickly positioned itself as a leading cryptocurrency with an astonishing 320% gain since July 21, carrying the altcoin into new highs yesterday. The emerging bearish momentum divergence on the intra-day charts may signal that the momentum driving LUNA higher is beginning to be exhausted, and speculators should prepare for a correction in the short term.
Terra price disregards last week’s DeFi hacks
Terra price has exploded as the arrival of a new altcoin season has gripped the cryptocurrency complex, delivering big winners like AXS and SOL in a short period. As a result of the altcoin fever, LUNA printed a new all-time this week, despite the DeFi hacks. Additionally, a bullish Golden Cross is fast approaching on the daily chart, confirming the Terra price advance and projecting further gains moving forward.
A higher Terra price may have to wait as the intra-day charts present a bearish momentum divergence, projecting a correction. The divergence gains importance as it is occurring as LUNA pushes above the all-time high of $23.30, established in March.
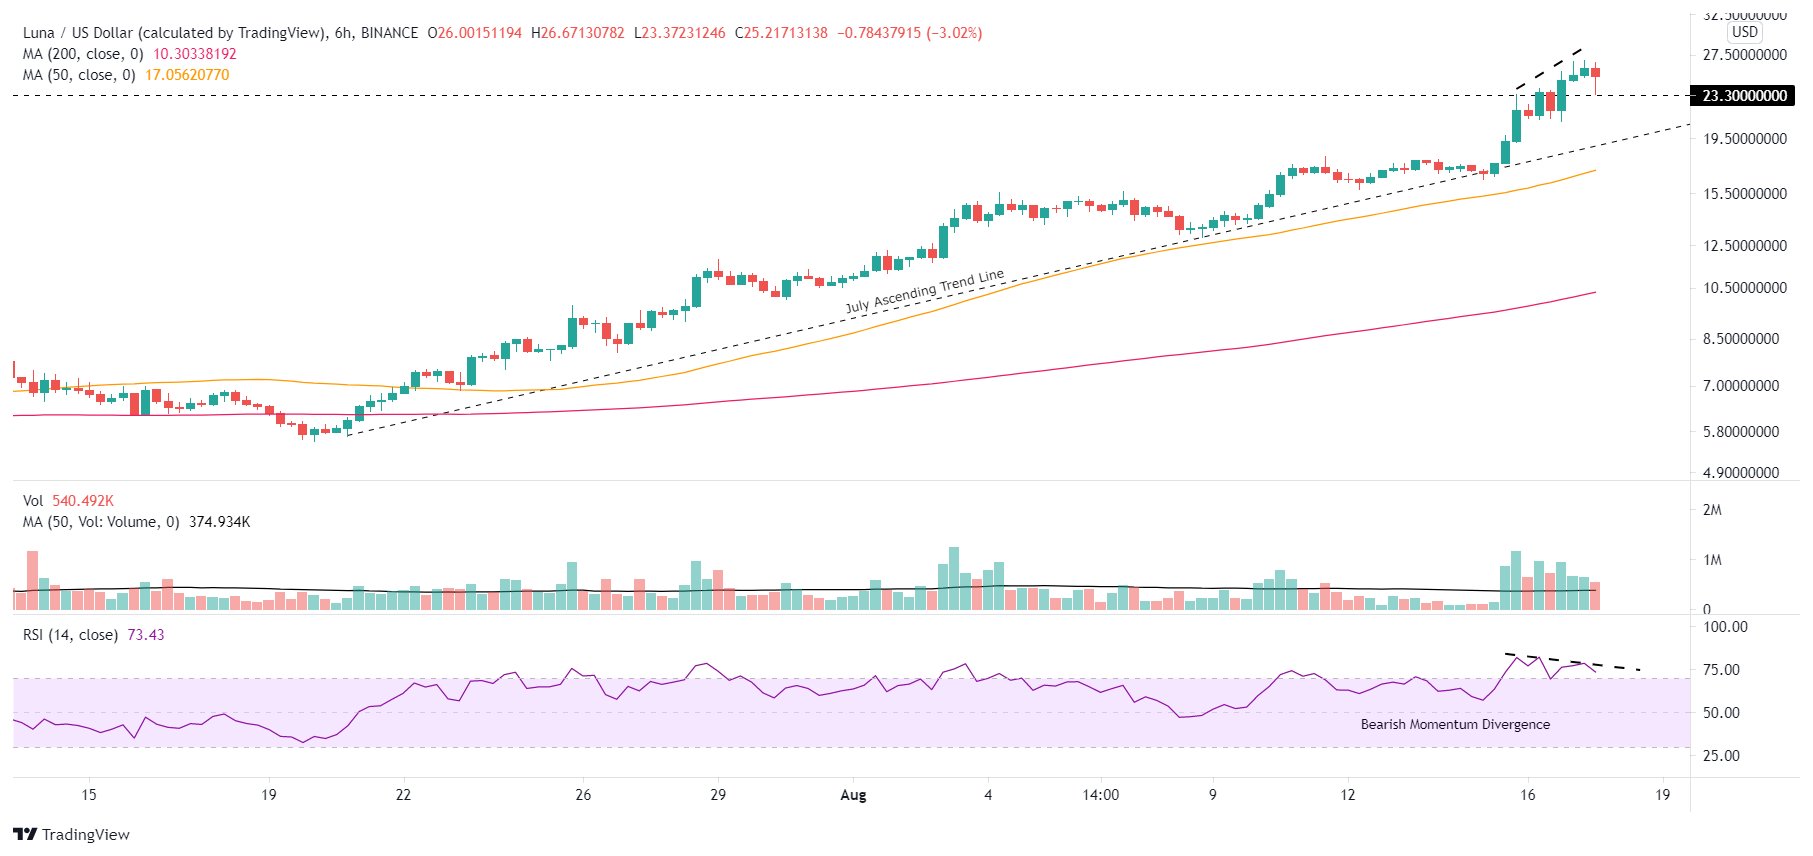
LUNA/USD 6-hour chart
Currently, the divergence is minor and could be reconciled with another strong day. Still, it would gain prominence in the Terra price narrative if LUNA closes below the previous all-time high of $23.30 on a daily basis. It would introduce a decline to a level of support formed by the 38.2% Fibonacci retracement of the advance from the March low at $18.68 and a series of highs from late April and early May, yielding a 26% drop from the current price.
If the 38.2% retracement level fails, Terra price will discover superior support at the 50% retracement level at $15.82, but it is a low probability scenario based on the current LUNA price structure.
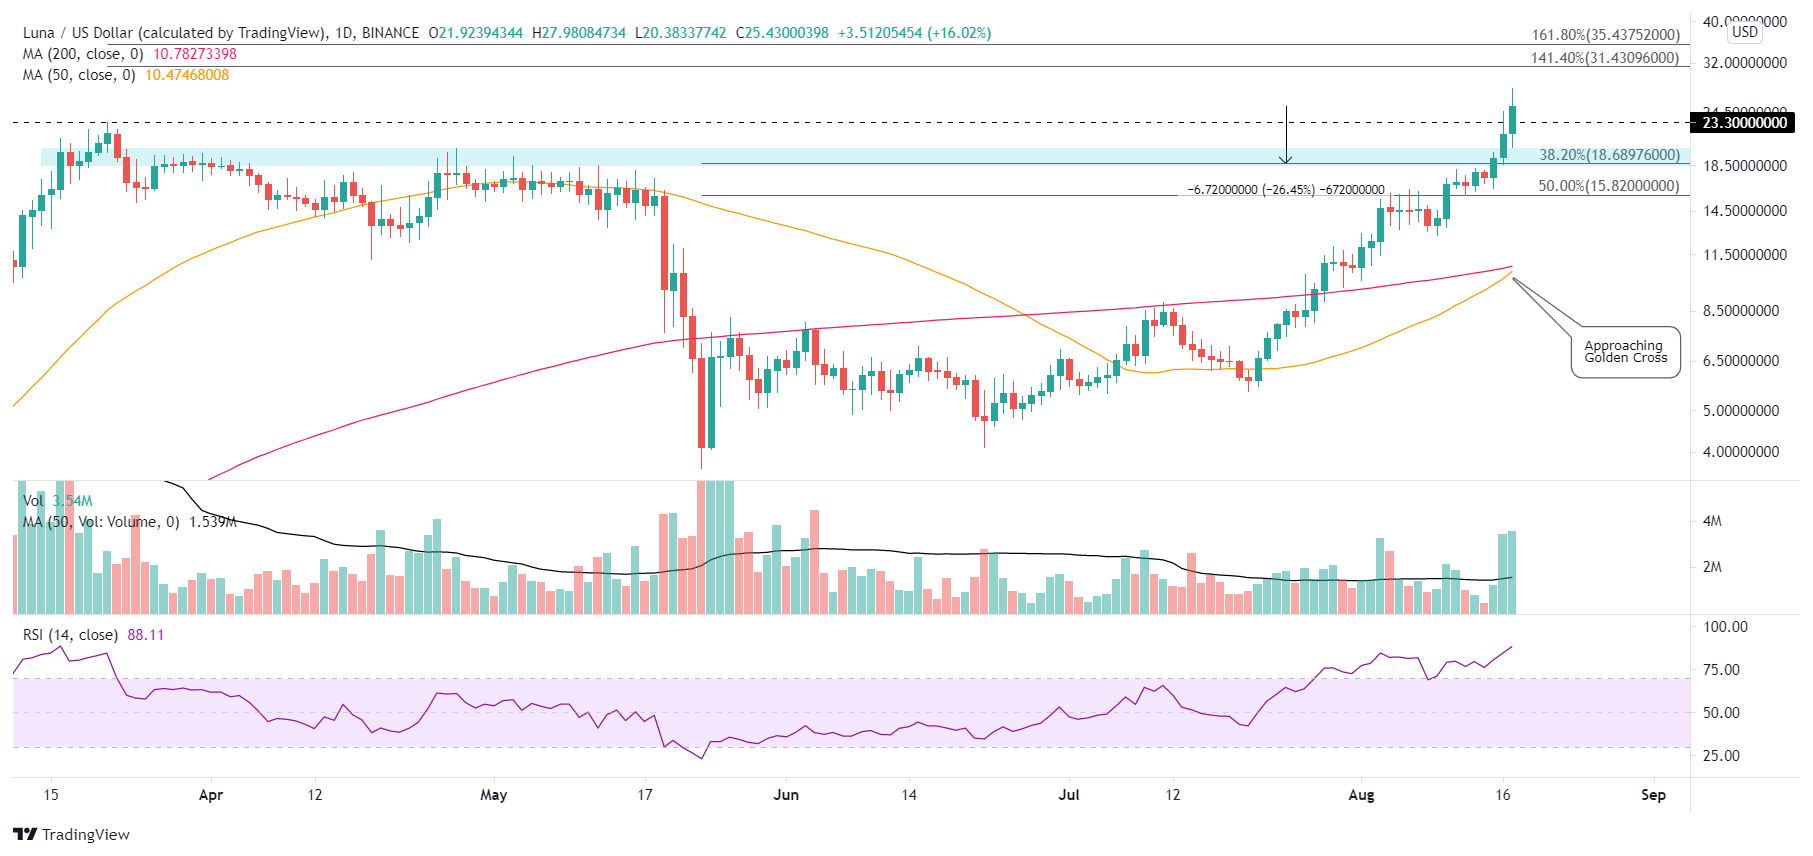
LUNA/USD daily chart
Alternatively, Terra price could extend the advance with a potential target emerging at the 141.4% extension of the March-May correction at $31.43 or the 161.8% extension at $35.43, representing a 42% jump from the current price.
An interesting twist to the LUNA story is the muted social media traffic dedicated to the digital token over the last month. The 7-day moving average (MA) is trending higher, but it is far from reaching the social dominance in March. Meanwhile, the 30-day MA has remained in a sideways trend. Thus, the weaker than expected social media coverage for LUNA does suggest that the Terra price advance has yet to attract the attention of retail speculators, improving the potential for higher prices.
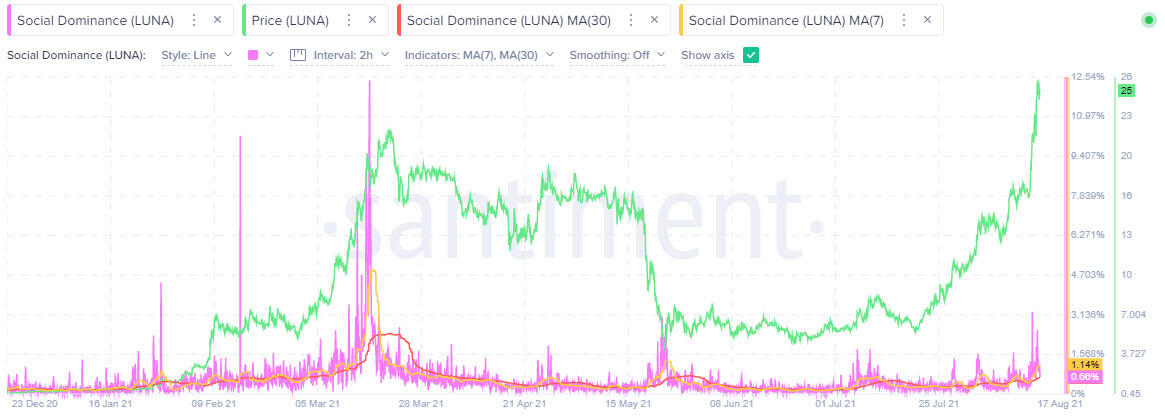
LUNA social dominance - Santiment
The Terra price uptrend, driven by the anticipated Columbus-5 network upgrade, which is set to go live in the next few weeks, has reached an inflection point. The intra-day RSIs show a new bearish momentum divergence as LUNA prints new highs. However, the limited social media traffic accompanying the advance reveals that FOMO has yet to embrace the altcoin, setting it up for higher prices after a brief consolidation.
Author

Sheldon McIntyre, CMT
Independent Analyst
Sheldon has 24 years of investment experience holding various positions in companies based in the United States and Chile. His core competencies include BRIC and G-10 equity markets, swing and position trading and technical analysis.


