Technical Weekly: Going nowhere

Key takeaways
-
Crypto market sentiment has little or no change despite the recent failed attempts of reclaiming the USD 7000-7200 levels.
-
Altcoin's bigger picture looks gloomy as the ex-BTC market cap shows bearish divergence.
-
Bitcoin Gold in focus as halving is expect is this week.
Market Overview
The cryptocurrency markets responded with a lukewarm enthusiasm after the BTC prices received multiple rejections at the USD 7200 levels. The leading cryptocurrency has been changing hands near the USD 6800 area on Asia Tuesday, after briefly touched the USD 6500 levels over the Easter long weekend. In our last edition of the Technical Weekly, we've mentioned that the resistance near the previous-mentioned neckline remained strong, and apparently, it remains intact.
Sentiment-wise, data shows that medium-term BTC investors have little or no change of expectations over BTC prices, although some short-term traders have expressed a slightly positive view. Sentix Bitcoin Sentiment Index rebounded and almost touched the neutral level. Still, Manfred Hubner, Managing Director at Sentix, believes that "bitcoin needs a significant gain of the strategic bias to push prices further upwards. Although this bias is currently greater than the sentiment, it has not increased further. Thus, no fundamentally new situation has arisen."
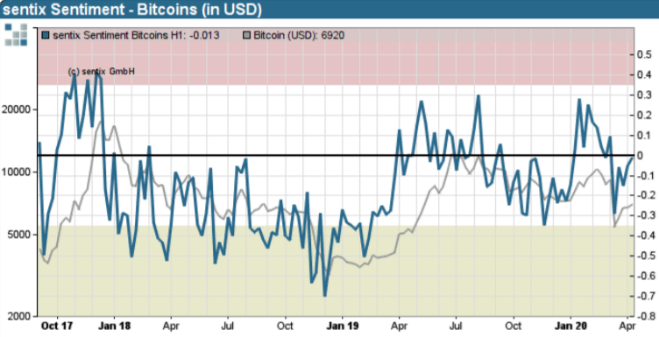
Figure 1: Sentix Bitcoin Sentiment Index (Source: Sentix)
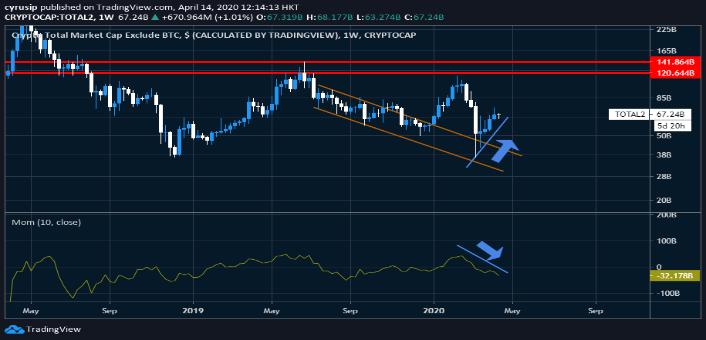
Figure 2: Crypto Total Market Cap Ex-BTC (Source: Tradingview)
Elsewhere, major altcoins were mostly in the green after BTC's rebound. The prices of BCH and BSV have initially stabilized after last week's hard fork. The pre-hard fork price actions have sent BCH to the USD 280 levels, while BSV hit the USD 220 area.
In a broader perspective, however, altcoin watchers could find reasons to worry about the markets. The momentum indicator of the total ex-BTC crypto market cap has been in a bearish divergence with the price, which may indicate that the broader rebound of altcoin could be short-lived. Of course, that doesn't mean the beginning of an altcoin sell-off in the short-term. However, the bigger picture here could be gloomy.
Price Analysis
BTCUSD – Support and resistance inching closer to each other
-
The previous head and shoulders neckline remained a strong resistance for the pair that came after the failed attempts of braking above the neckline last week and left a shooting star-like pattern, which considered a bearish sign.
-
On top of that, the 50-day moving average seems another significant resistance.
-
Momentum-wised, it showed a mixed-signal, with the MACD has been in contraction, while the OBV remained in a sideways pattern (not shown here), and a reversal is yet to confirm.
-
Considered the broader lukewarm sentiment, we believe that the chance of the price breaking above the neckline remained subdued, at least for the short-term. However, the likelihood of having a significant correction is also low.
-
The reattempt of the 7100 to 7200 should not be ruled out in the near-term. The lower area to watch could be 6700 to 6500, if seen, the retest of the 61.8% Fibonacci Retracement near 6300 will get more likely.
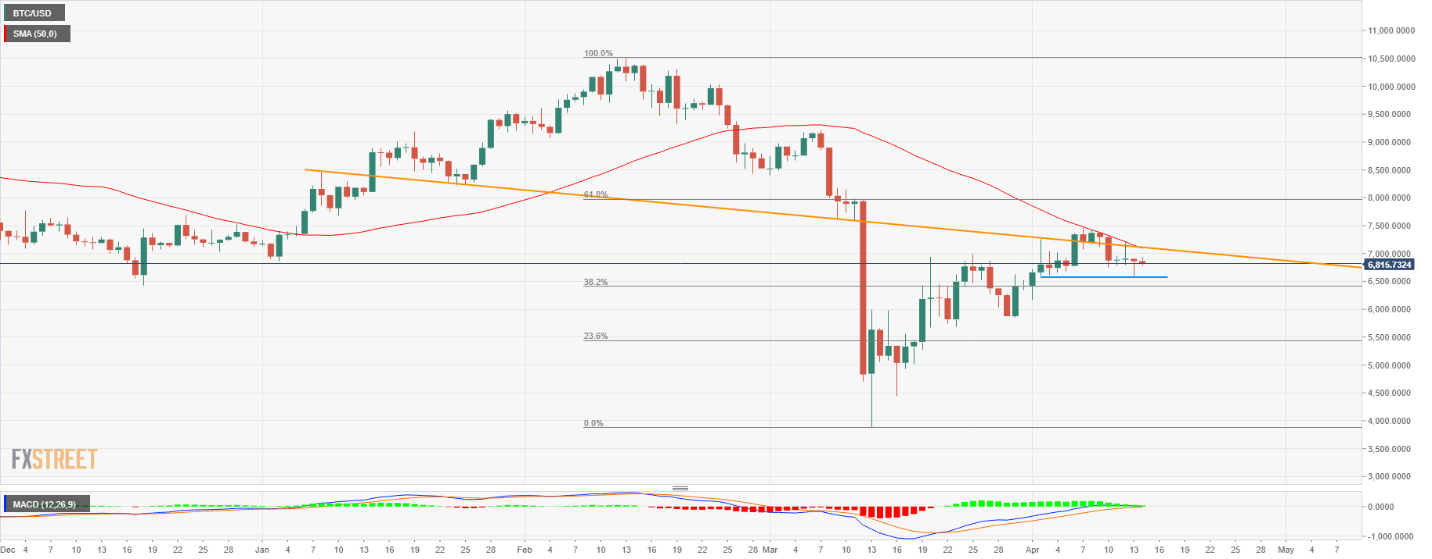
Figure 3: BTCUSD Daily Chart (Source: FX Street)
ETHUSD – Key trendline support to be tested
-
We highlighted the daily ascending triangle formation in our last <Technical Weekly>, and a positive breakout is confirmed. The question now is whether the ascending price trend can continue.
-
The bias could slight tilt to the downside, as the MACD suggests that the momentum has been fading, while the ultimate oscillator dropped to its trendline support levels.
-
However, a daily bullish crossover seems in the making in the stochastic oscillator, suggesting inflows into the pair have been increasing in the near-term.
-
The critical level to watch could be near 150, which is the resistance-turned-support levels from the previous ascending triangle. 164 is another key level to watch, which is near the 38.2% FR.

Figure 4: ETHUSD Daily Chart (Source: FX Street)
LTCUSD – Bias towards downside?
-
LTCUSD is another interesting pair to watch, as it has produced some 3-hour lower highs, a descending triangle pattern seems to have formed.
-
Although a short-term downward channel is developed, the ultimate oscillator has produced a bullish divergence with some higher highs. The momentum indicator is expected to test its trendline support in the coming days, and this could be crucial for the price action development in the short-term.
-
MACD indicates that the momentum has been somewhat slowing down.
-
In conclusion, the pair could first retest the 3-hour triangle support near the 250-MA at 39.5, before trying to reclaim the upper resistance near 41.3.
-
Although a breakout is expected, however, it is still too early to determine the timing of the breakout.
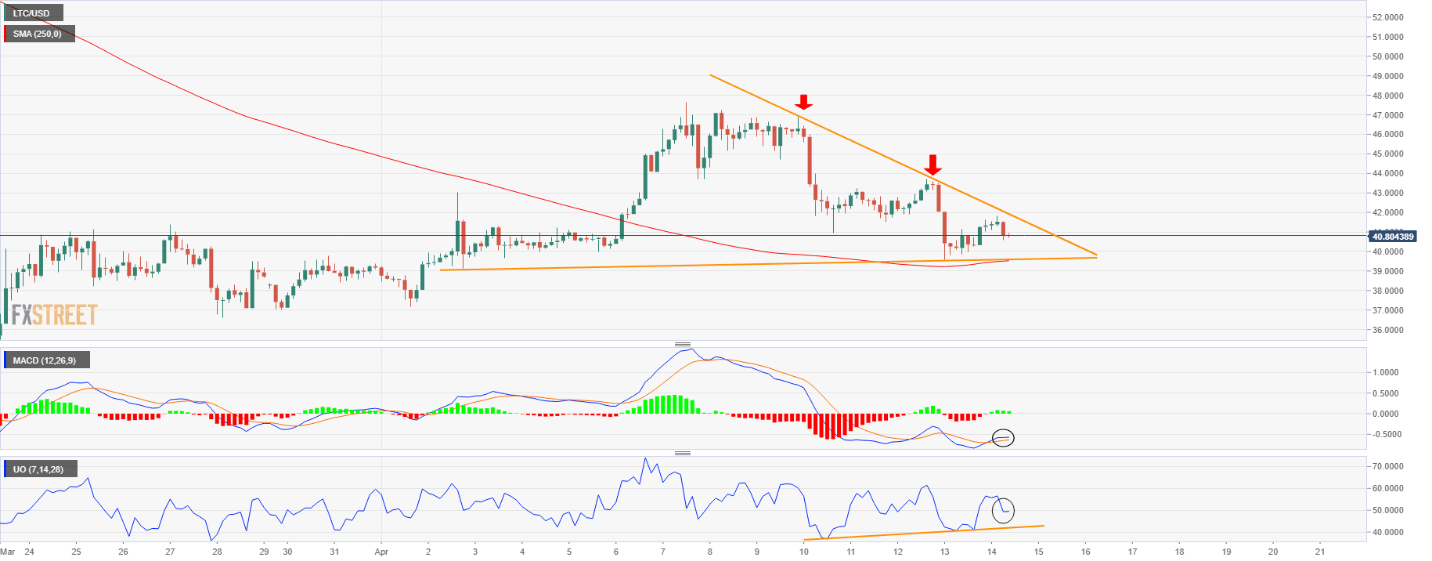
Figure 5: LTCUSD 3-Hour Chart (Source: FX Street)
BTGUSD – A turn before halving?
-
Bitcoin Gold is another market focus this week, as its block reward halving is expected to take place on Thursday.
-
Despite halving may generally have a positive impact on the price; the recent rally looks tired and could be running out of steam.
-
The slow stochastic has once again reached near the overbought area. It has been a strong signal of the price may have to take a turn as previous cases suggested.
-
The 250-day moving average near 8.90 could be the first level to watch, which is the area near the previous channel top, if such levels were given up, the retest of the recent channel support near 8.30 should be ruled out.
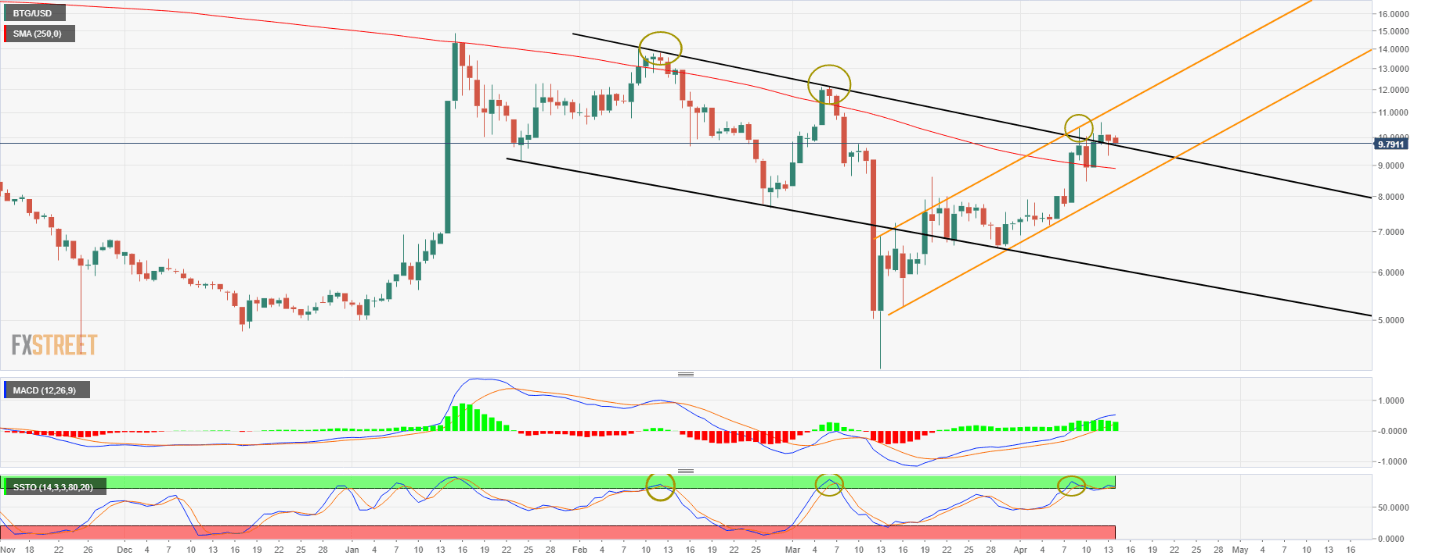
Figure 6: BTGUSD Daily Chart (Source: FX Street)
Author

Cyrus Ip
OKEx
Cyrus Ip has the privilege to work with OKEx as a Research Analyst, where he found some of the brightest talents in the crypto space.


