Sui Price Forecast: SUI loses ground amid fears over upcoming 44 million token unlock
- Sui edges lower for the third consecutive day, getting closer to the key 50-day EMA at $3.49.
- The bearish momentum grows ahead of the 44 million tokens unlock scheduled on Friday.
- The derivative data outlines a sell-side dominance amid increased capital outflows.

Sui (SUI) loses ground by nearly 2% at press time on Wednesday, extending the pullback for the third consecutive day. The downside risk escalates for Sui as its Open Interest declines ahead of a 44 million token unlock on Friday. The technical outlook suggests a bearish tilt and, if the recent downtrend persists, the token could potentially test the 50-day Exponential Moving Average (EMA) at $3.49.
44 million SUI tokens to be unlocked on Friday
In accordance with the SUI roadmap, 44 million SUI tokens worth $166.30 million will be unlocked on Friday. The unlock will increase the circulating supply by 1.28%.
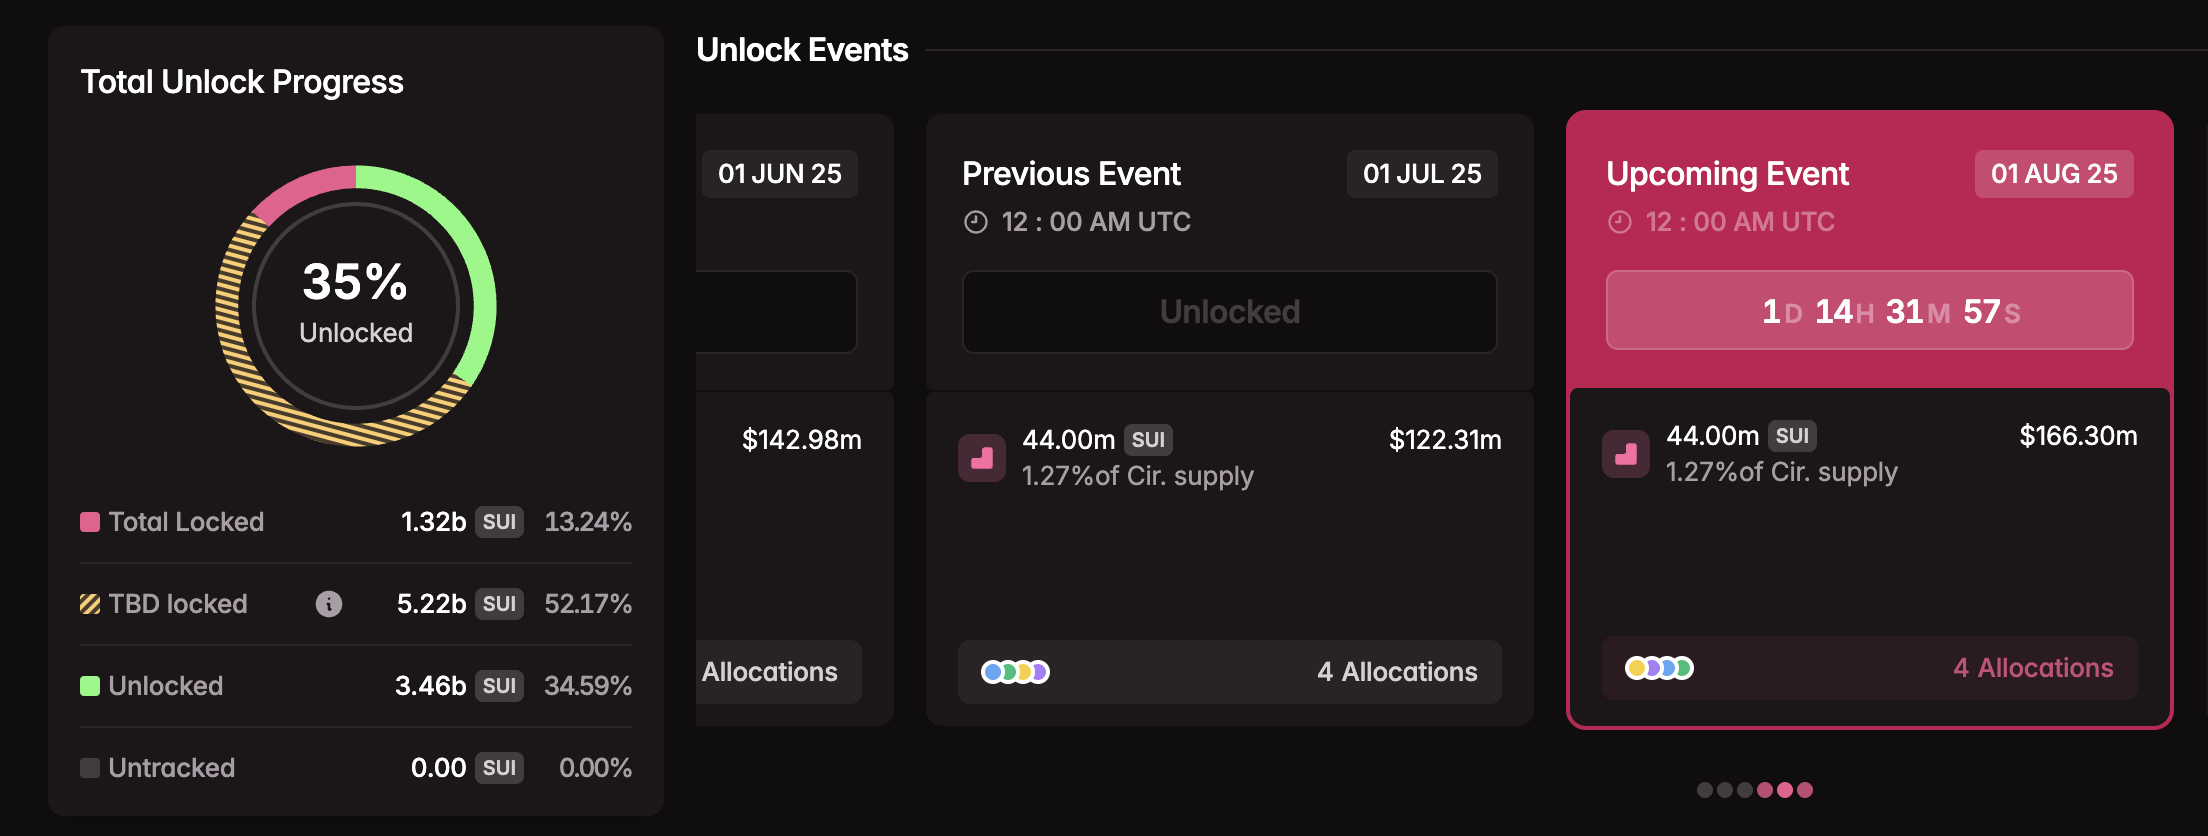
Sui token unlock data, Source: Tokenomist
Typically, a token unlock event increases the risk of a supply dump in the market, as investors may consider booking profits from the unlocked tokens. However, if the investors' confidence holds steady, the unlocked supply could be redirected to Decentralized Finance (DeFi) services or held for capital appreciation.
Token unlock fear seeps into SUI derivatives
CoinGlass’ data shows the SUI Open Interest at $2.30 billion, down from $2.41 billion on Tuesday. This $110 million capital outflow from the SUI futures and options contracts suggests a decline in traders’ interest in the token.
The liquidation data reveals $4.53 million in long liquidations compared to $287.44K in shorts in the last 24 hours, indicating a greater wipeout of bullish positions. Adding credence to bearish dominance, the long-to-short ratio stands at 0.9309, meaning that more traders are in short positions.
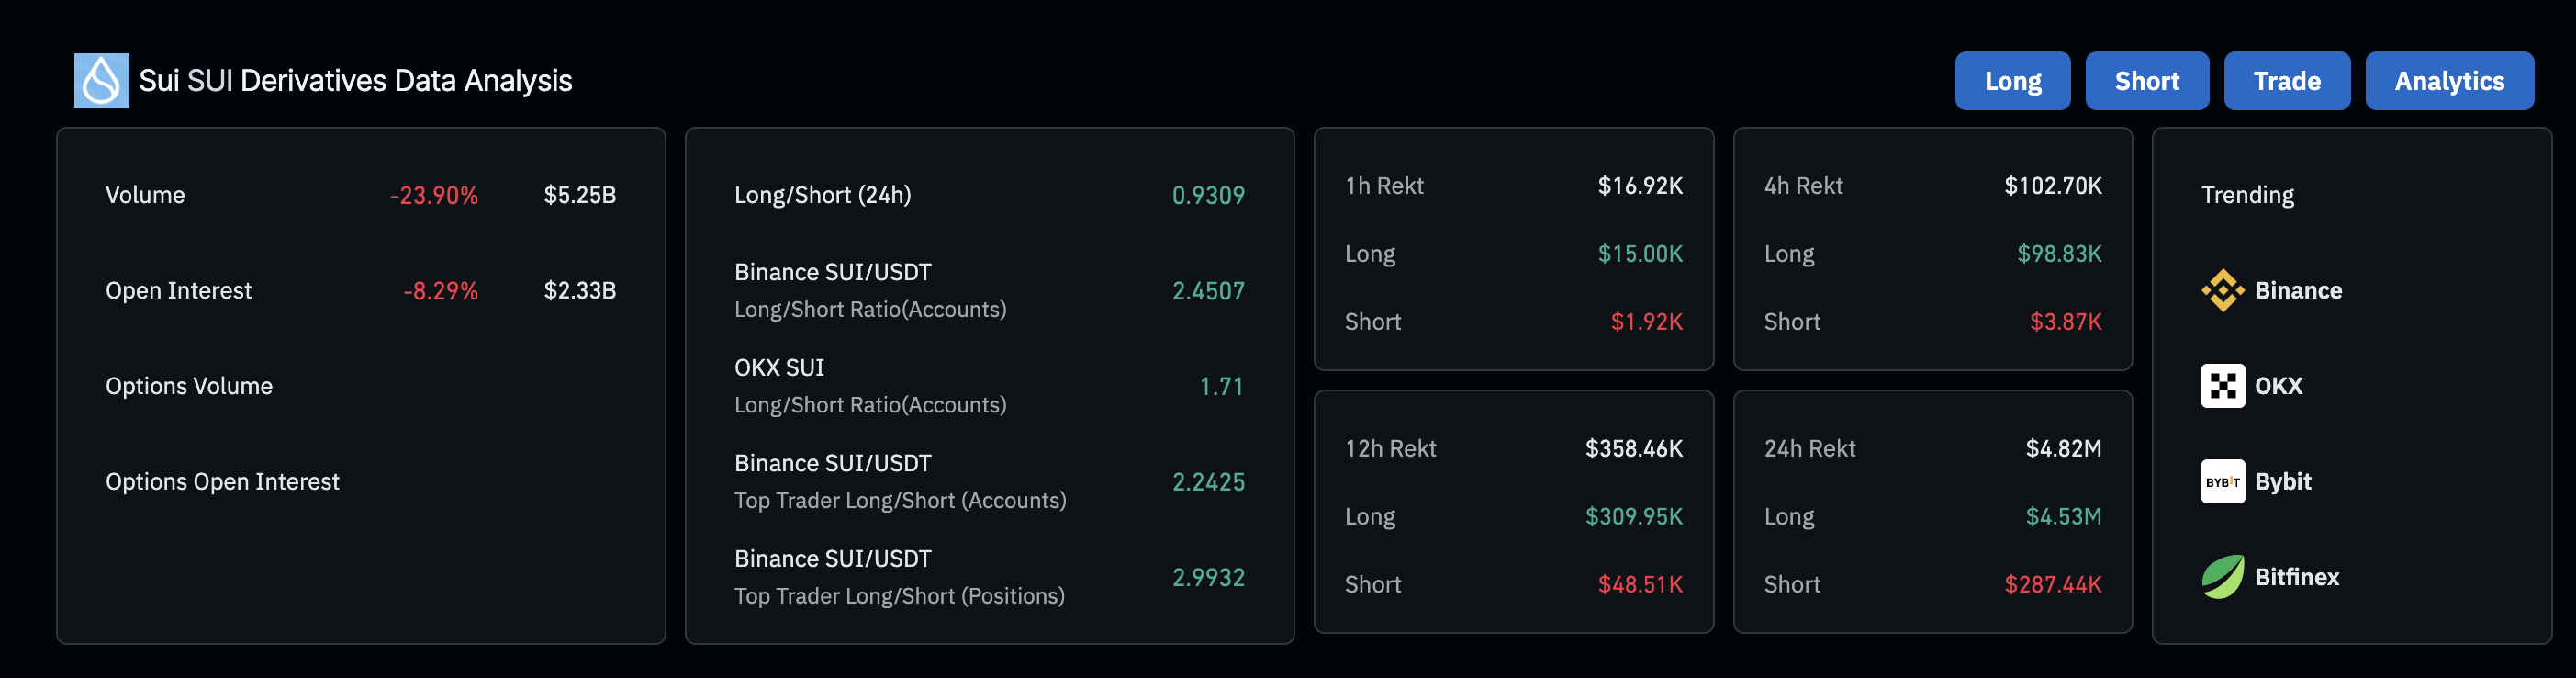
Sui derivatives data. Source: Coinglass
SUI risks retesting 50-day EMA
SUI extends the declining trend under the $4.00 mark with its third consecutive bearish candle, erasing the gains from last week. The layer-1 altcoin inches closer to the 50-day EMA at $3.49 as the Relative Strength Index (RSI) is close to neutral levels at 51 but points downwards, indicating a decrease in buying pressure.
Investors may consider increasing bearish exposure as the Moving Average Convergence Divergence (MACD) crossed below its signal line on Monday, signaling a potential sell.
A decisive close below the mentioned 50-day EMA could test the 200-day EMA at $3.16.
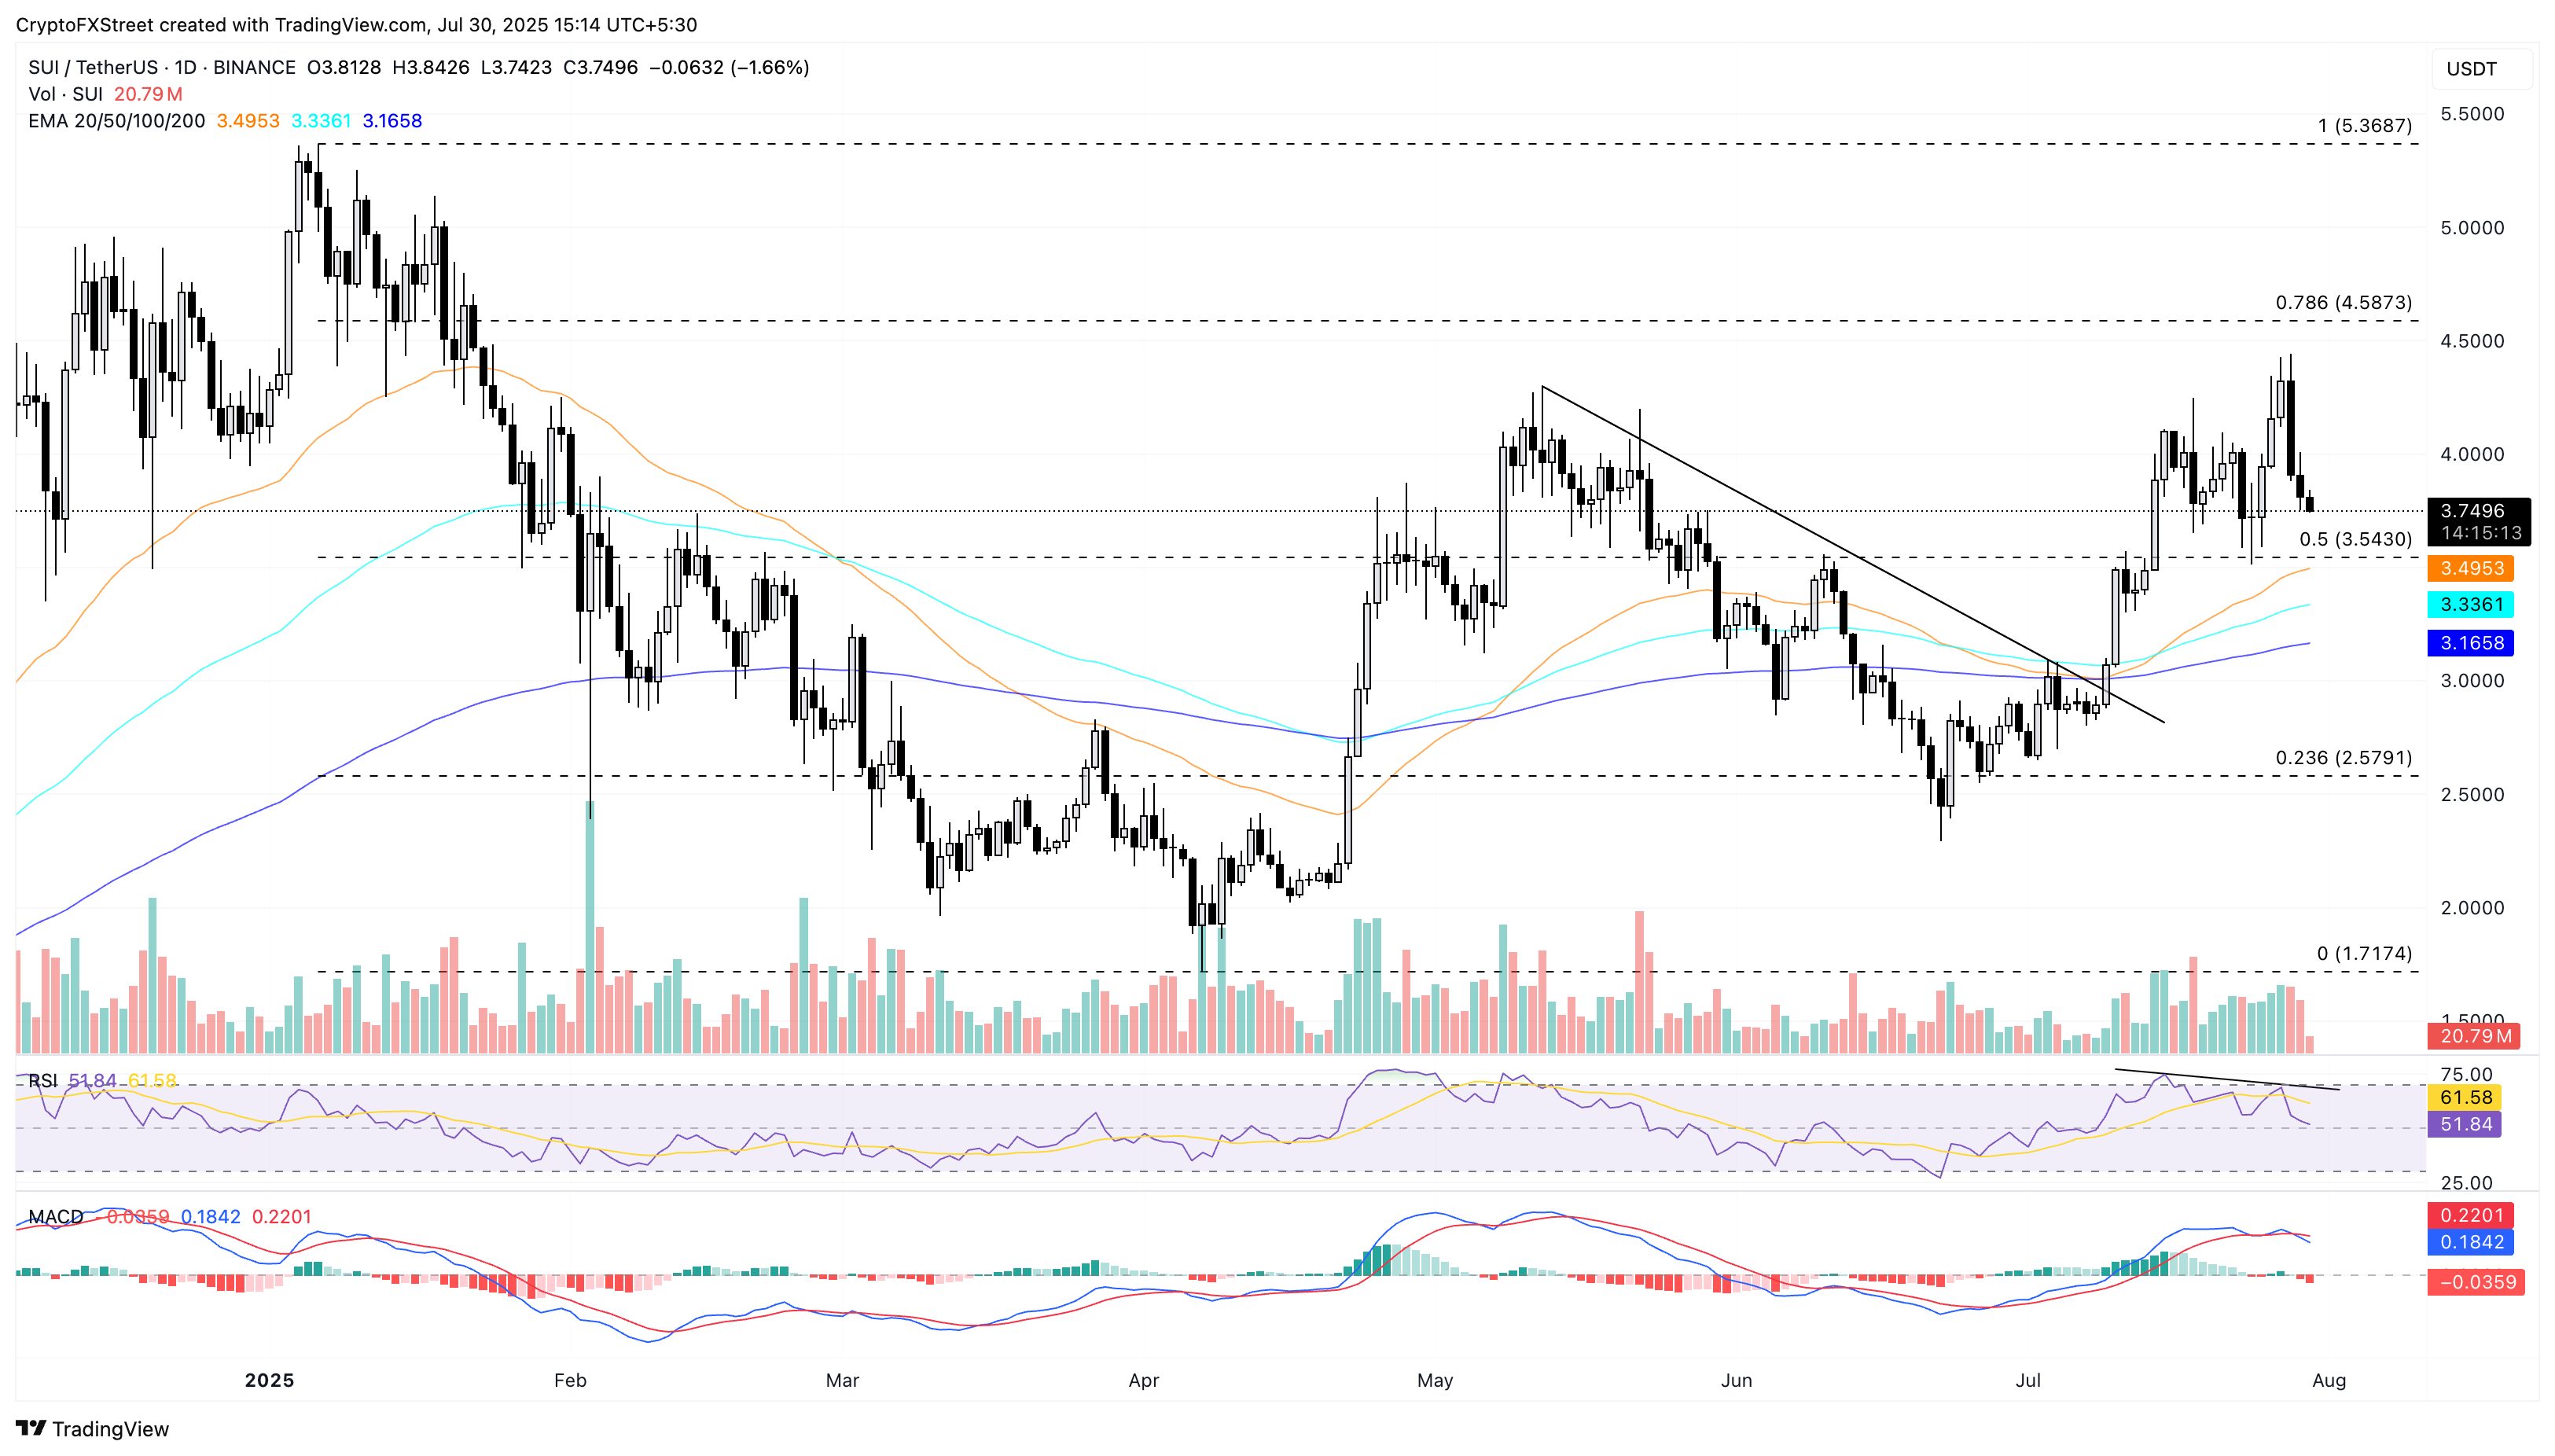
SUI/USDT daily price chart.
On the flip side, a bounce back from the 50% Fibonacci level at $3.54, drawn from $5.36 on January 6 to $1.71 on April 7, could retest the $4.00 level.
Author

Vishal Dixit
FXStreet
Vishal Dixit holds a B.Sc. in Chemistry from Wilson College but found his true calling in the world of crypto.




