Stellar Price Forecast: Bullish momentum builds with technical breakout, transaction activity hits quarterly high
- Stellar price trades slightly lower on Friday after closing above the descending trendline, suggesting a bullish move.
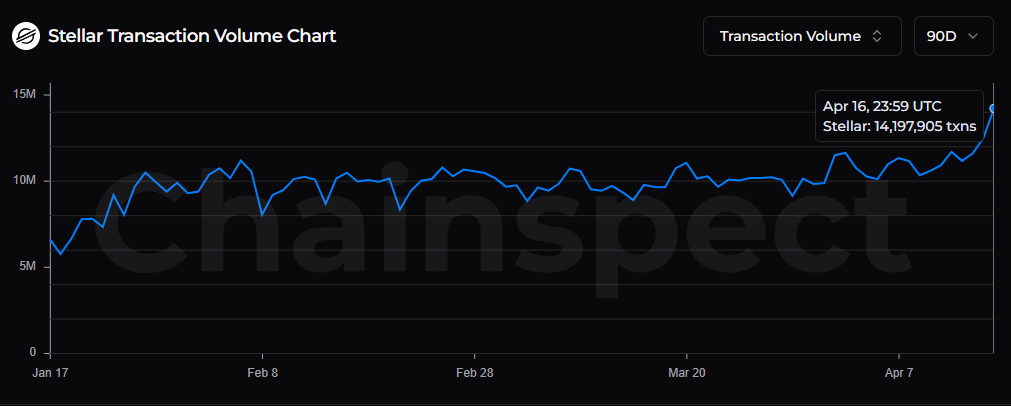
- Network activity surges, with over 14.19 million transactions recorded this week, the highest level in the past quarter.
- Improving momentum indicators alongside positive funding rates signal a possible upside move.

Stellar (XLM) price trades slightly down at $0.167 on Friday, after breaking above the descending trendline and rallying over 10% so far this week. The bullish sentiment builds as XLM’s network transactions reach a quarterly high, alongside positive funding rates and bullish momentum indicators.
Surge in network activity
Chainspect, a blockchain fundamentals tracker, data shows that Stellar processed over 14.19 million transactions on Thursday, its highest level in the past quarter. These surging transactions highlight increased interest and liquidity among traders in the XLM, supporting a bullish outlook.
On the derivative side, XLM funding rates have also flipped positive on Monday and read at 0.011% on Friday, indicating the longs are paying the shorts. Historically, when funding rates have turned positive and surged, XLM price has rallied sharply.
XLM Price Forecast: Price action shows a bullish breakout in play
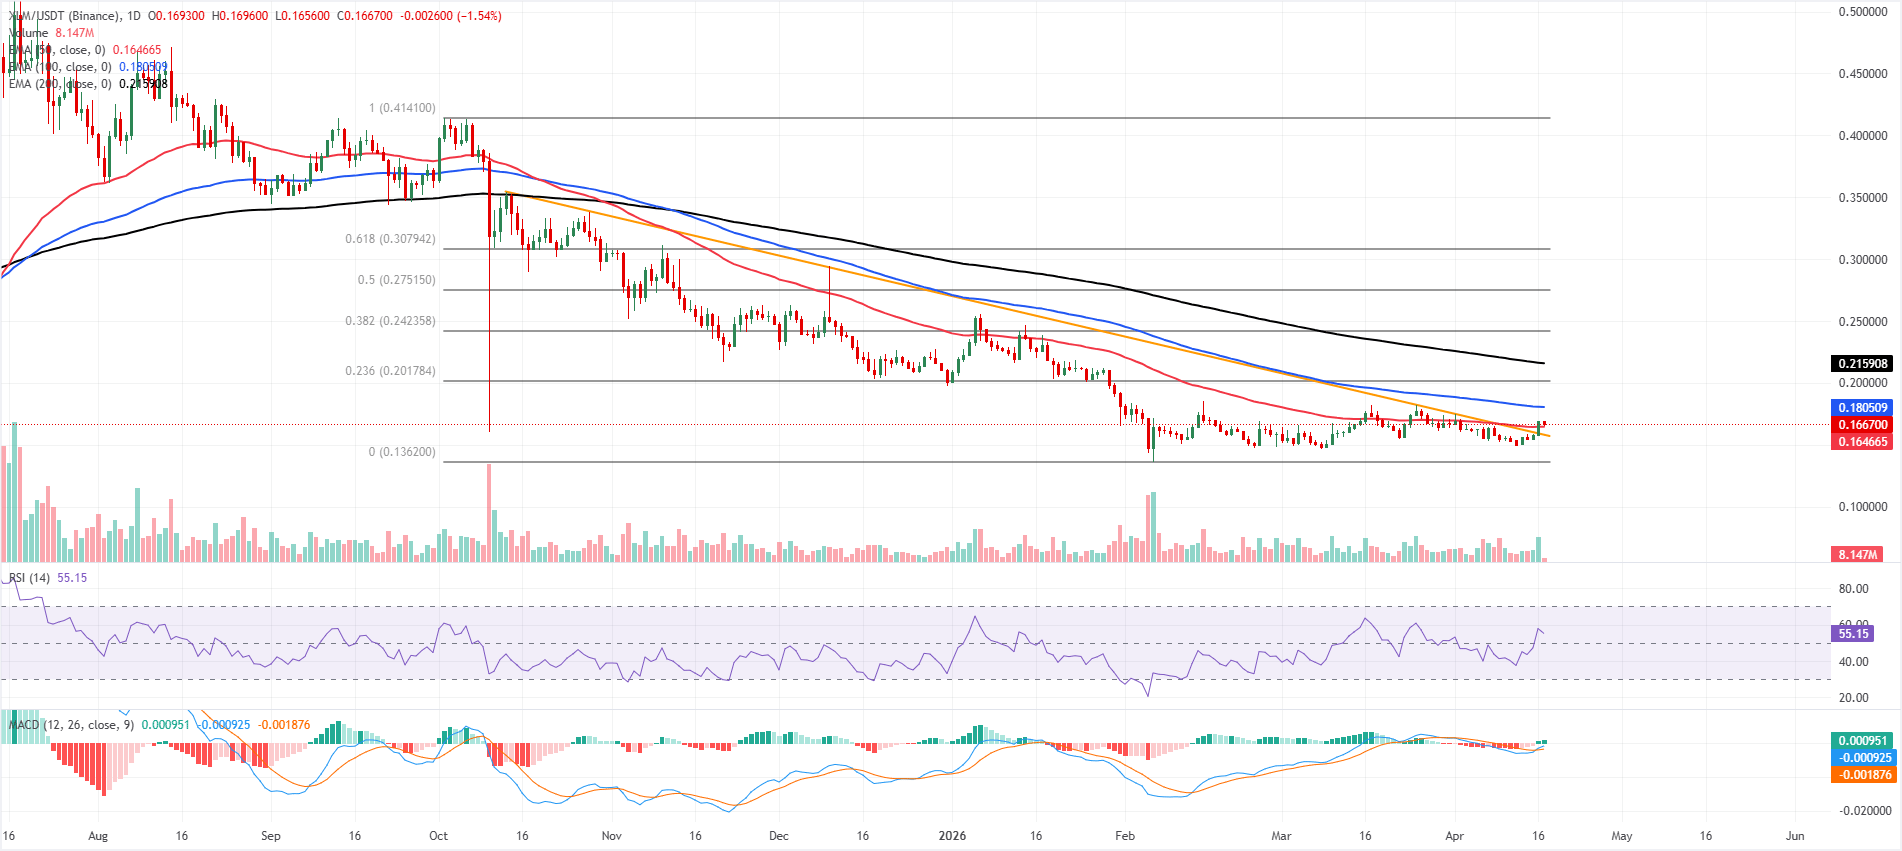
Stellar price is trading at $0.166 on Friday, after breaking above the descending trendline at $0.1580 the previous day. XLM is maintaining a corrective tone below the medium- and long-term Exponential Moving Averages (EMAs) as the current price remains capped beneath the 100-day EMA at $0.180 and well under the 200-day EMA at $0.215.
The 50-day EMA at $0.164 now offers nearby dynamic support, while the Relative Strength Index (RSI) around 55 and a slightly positive Moving Average Convergence Divergence (MACD) histogram hint that downside momentum has faded but not yet flipped the structure.
On the topside, initial resistance is seen at the 100-day EMA around $0.180, followed by the 23.6% Fibonacci retracement of the broader downswing at $0.201 and the 200-day EMA near $0.2159. Higher up, additional Fibonacci barriers cluster at $0.242 and $0.275, with deeper retracement hurdles at $0.307.
On the downside, immediate support is provided by the 50-day EMA at $0.164, ahead of the former trendline break area near $0.158; a loss of this zone would expose the $0.136 swing low region, where the Fibonacci anchor creates a more substantial floor.
(The technical analysis of this story was written with the help of an AI tool.)
Author

Manish Chhetri
FXStreet
Manish Chhetri is a crypto specialist with over four years of experience in the cryptocurrency industry.




