Solana price shows early signs of weakness, here’s the scenario investors should be aware of
- Solana price has breached the 8-day simple moving average.
- SOL price has been rejected at a critical Relative Strength Index level.
- Invalidation of the bearish downtrend is a breach above $43.

Solana price shows early signs of a bearish downtrend underway. The invalidation level is a vital determinant of future price action.
Solana price shows weakness
Solana price shows exhaustion as the bulls have lost the battle for the $40 barrier. Since June 13, when lows were established at $25.86, the centralized smart contract token has managed to rally 65%. Now the unfolding selloff could become cataclysmic as the bears have breached the 8-day simple moving average (SMA), forcing early bulls to jump ship. The Relative Strength Index confounds a sneakily bearish move underway as the selloff occurred directly at the sellers’ 65 level.
Solana price next bullish support zones must hold, or the June 14 lows at $25.86 could be disastrously breached. A breach of the low could induce a bearish frenzy with targets in the $10 vicinity. A Fibonacci rejection tool surrounding the June 13 low and recent June 24 high of $42.94 shows the 61.8% retracement level at the $31 price level. Traders should consider this as the final bullish support zone. A close below $31 will fuel bearish confidence and an influx of bearish breakout traders into the market to target the June 13 swing low.
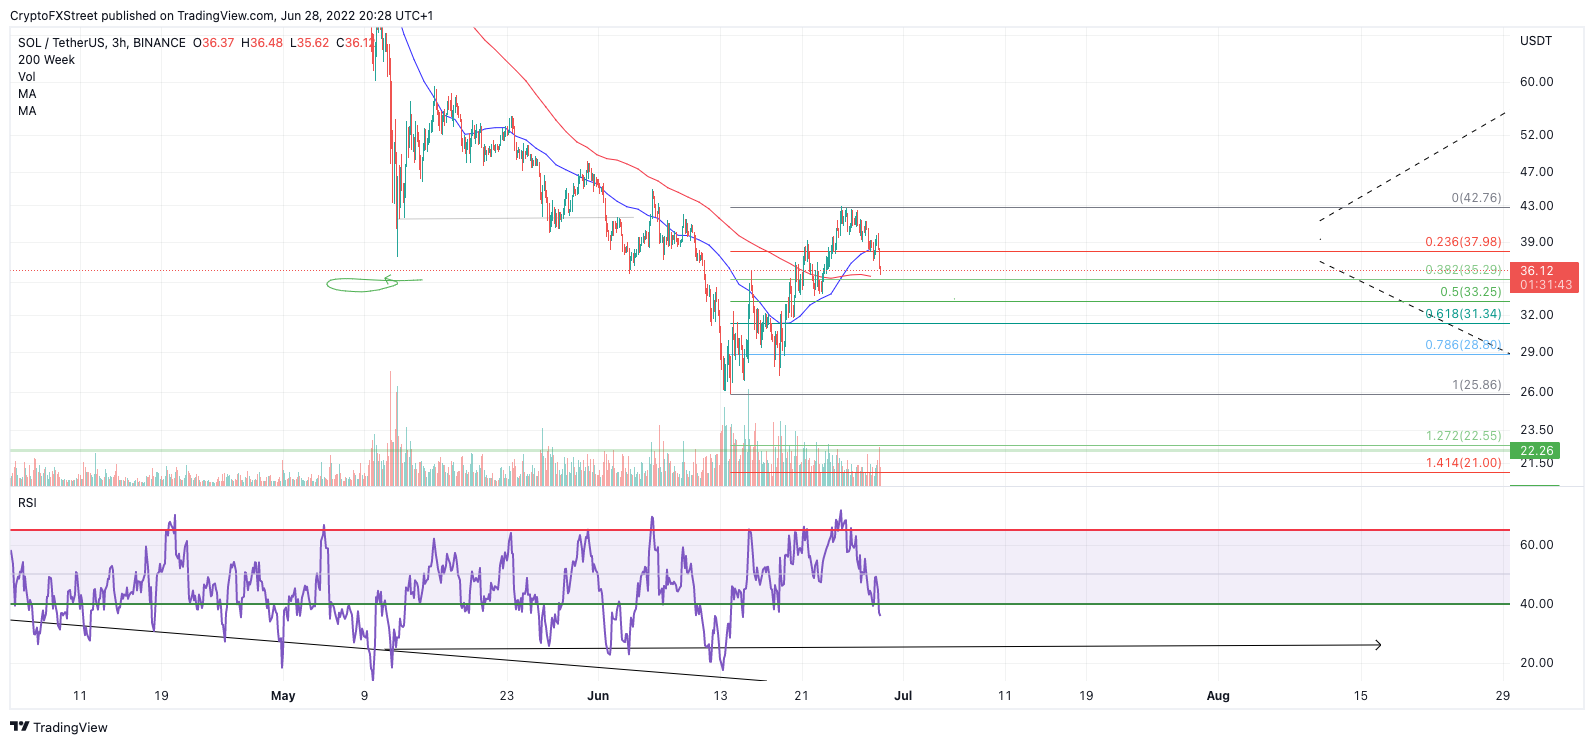
SOL/USDT 3-Hour Chart
Invalidation of the bearish downtrend is a breach above $43. If the bulls can conquer this level, they may be able to propel into the $50 price zone, resulting in a 40% increase from the current Solana price.
Author

Tony M.
FXStreet Contributor
Tony Montpeirous began investing in cryptocurrencies in 2017. His trading style incorporates Elliot Wave, Auction Market Theory, Fibonacci and price action as the cornerstone of his technical analysis.


