Solana price makes another run towards $100
- Solana price makes another attempt to break out of its falling wedge pattern.
- A halt against key resistance appears to stall further buying pressure.
- Bears look for an opportunity to regain control.

Solana price completed a very bullish close on Wednesday, but the follow-through trading on Thursday appears to be waning. Bulls display weakness and an inability to pursue a clear breakout above some critical resistance levels. As a result, bears may easily regain control of the market.
Solana price at a tipping point, bullish conviction is tested near the $90 value area
Solana price action may be on its way to completing its fourth consecutive green/white daily candlestick, but likely without further follow-through. The price level that SOL is finding difficult moving and closing above is in the $90 to $95 value area. The resistance level that bulls are attempting to break are:
- The upper trendline of the rising wedge pattern at $90.
- The Kijun-Sen at $92.
- The bottom trendline of a prior bull flag at $92.
- The 61.8% Fibonacci ret at $92.
The above resistance levels encapsulate the strongest collection of resistance levels on the Solana price daily chart. Bulls will have a much easier time pushing Solana price to $100 and higher if they can break those resistance levels.
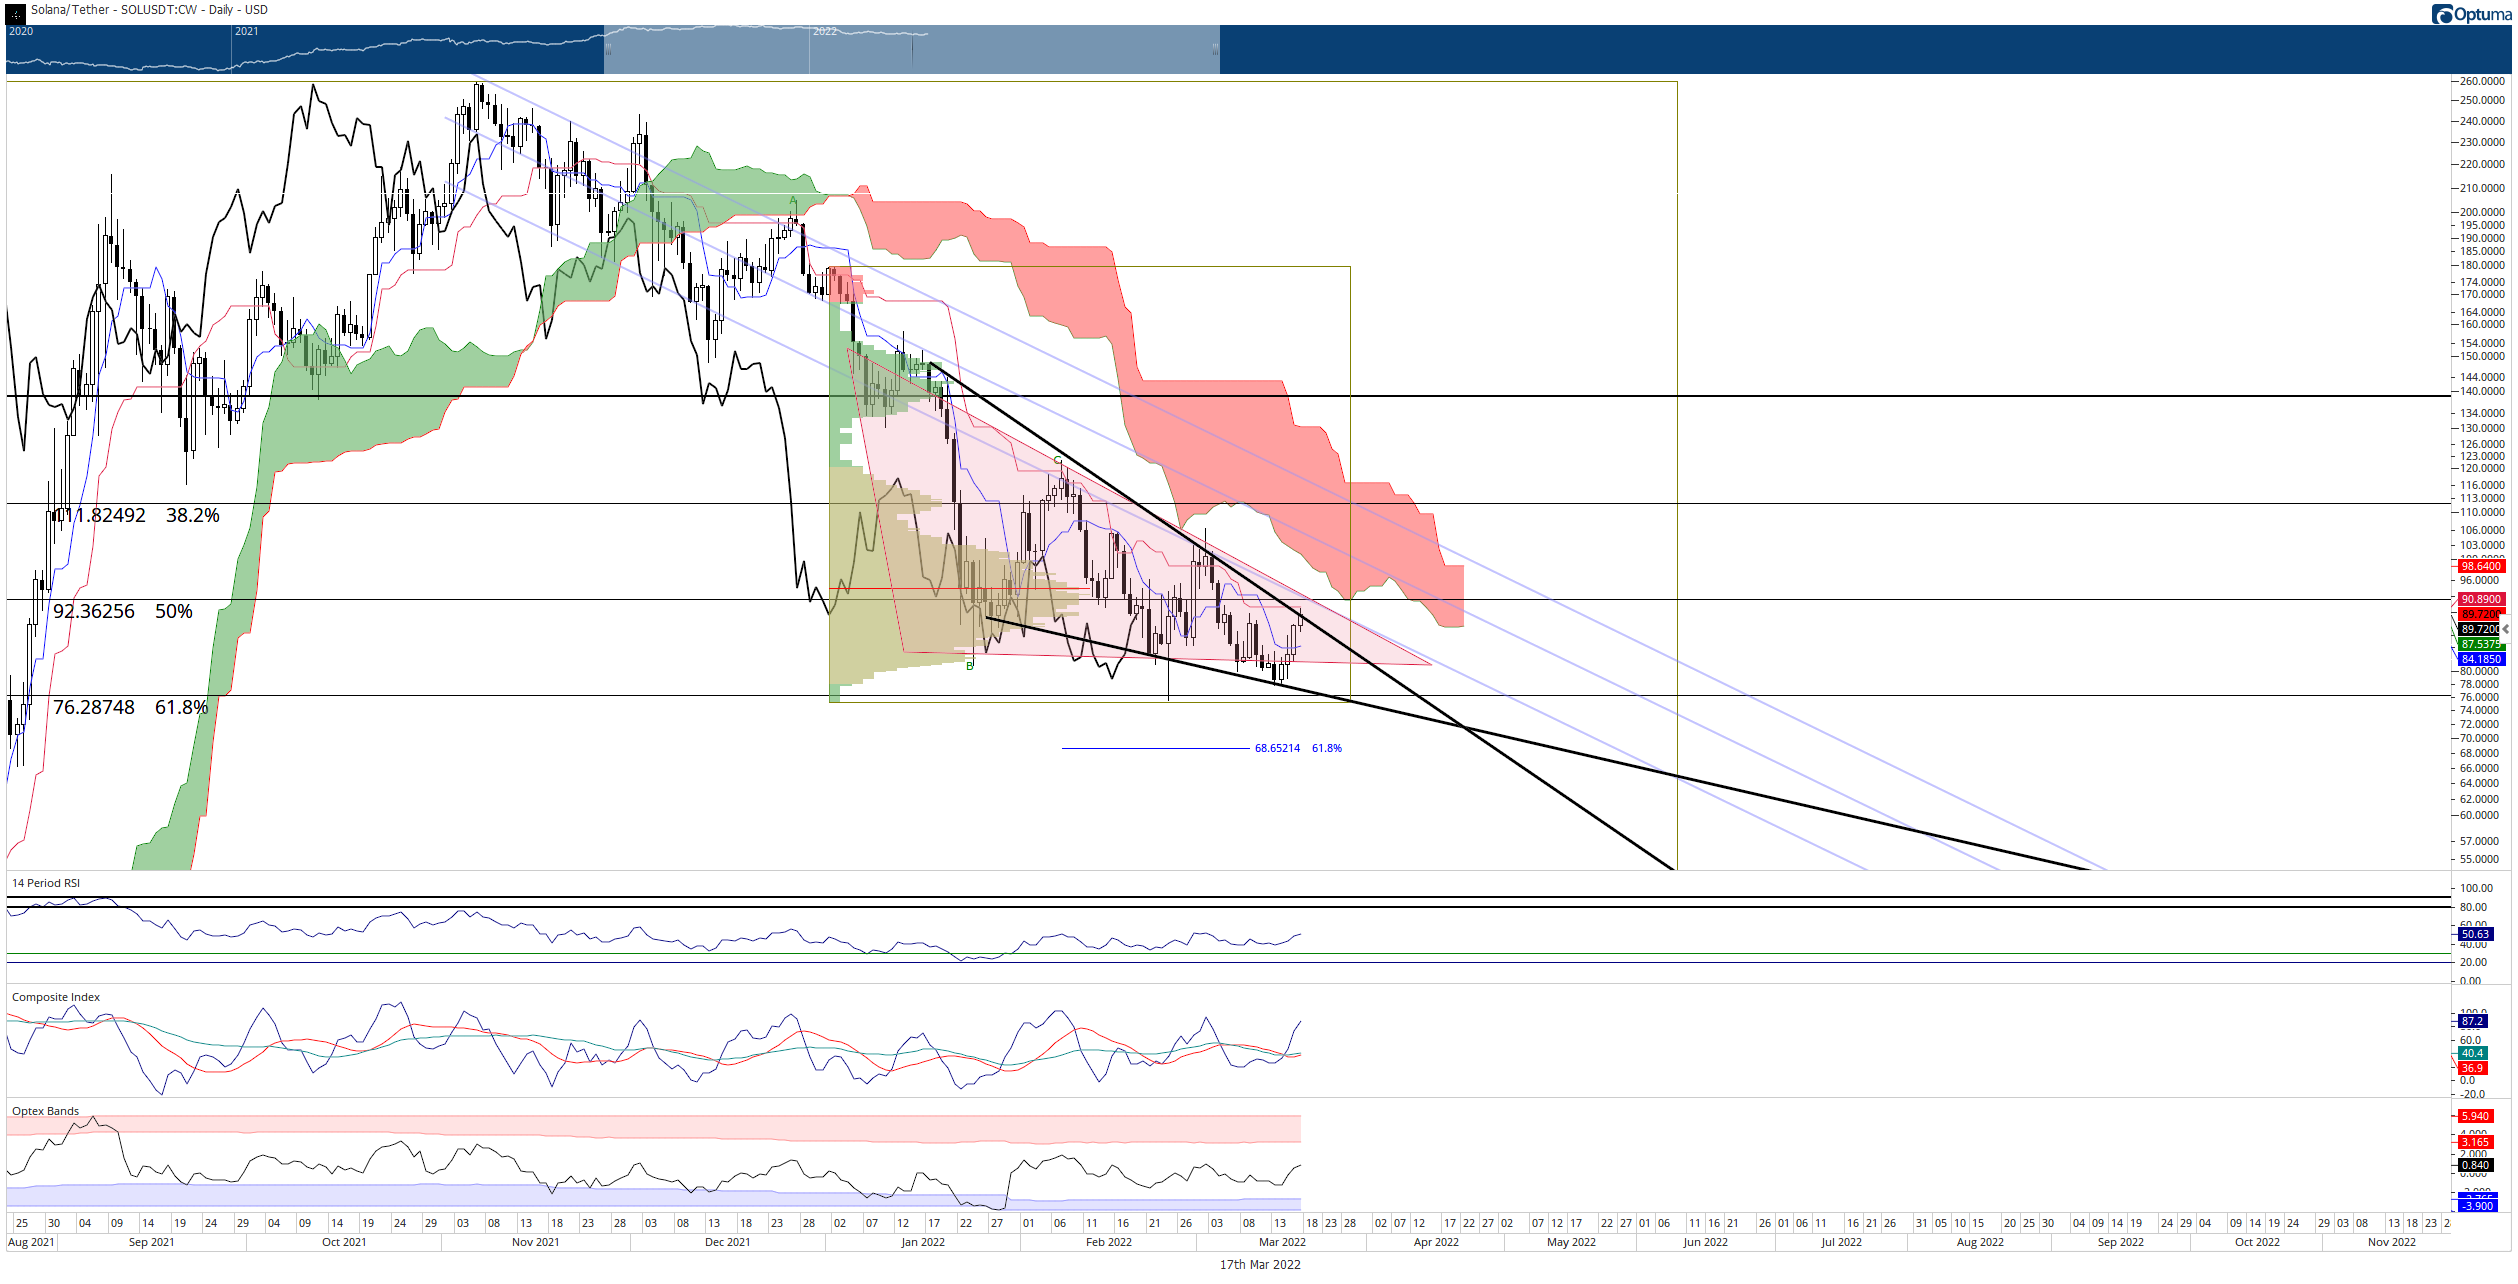
SOL/USDT Daily Ichimoku Kinko Hyo Chart
However, downside risks remain substantial. Because Solana price is below the Ichimoku Cloud, it is naturally in a bearish mode. Rejection against the $90 resistance cluster would likely mean a continuation of the selling pressure.
The target zone on a bearish continuation move below the descending triangle is likely the $50 value area. $50 is where the upper range of the 2021 Volume Point Of Control and the 100% Fibonacci expansion level exist.
Author

Jonathan Morgan
Independent Analyst
Jonathan has been working as an Independent future, forex, and cryptocurrency trader and analyst for 8 years. He also has been writing for the past 5 years.


