Solana Price Forecast: SOL trades below $85 as momentum weakens
- Solana price trades below $85 on Wednesday after falling over 3% in the previous two days.
- Derivatives data shows a slight bullish tilt, with positive funding rates and rising long positions.
- Traders should be cautious as momentum indicators weaken, while muted ETF demand and falling social dominance continue to cap upside momentum.

Solana (SOL) price remains under pressure, trading below $85 on Wednesday after losing more than 3% over the past two days. Broader market sentiment remains mixed, with a slight bullish tilt from the derivatives data, while fading momentum indicators, muted institutional demand and declining social dominance highlight weakening market participation. This suggests upside potential could remain limited unless bulls successfully reclaim key resistance levels.
Solana’s derivatives metrics tilt slightly bullish
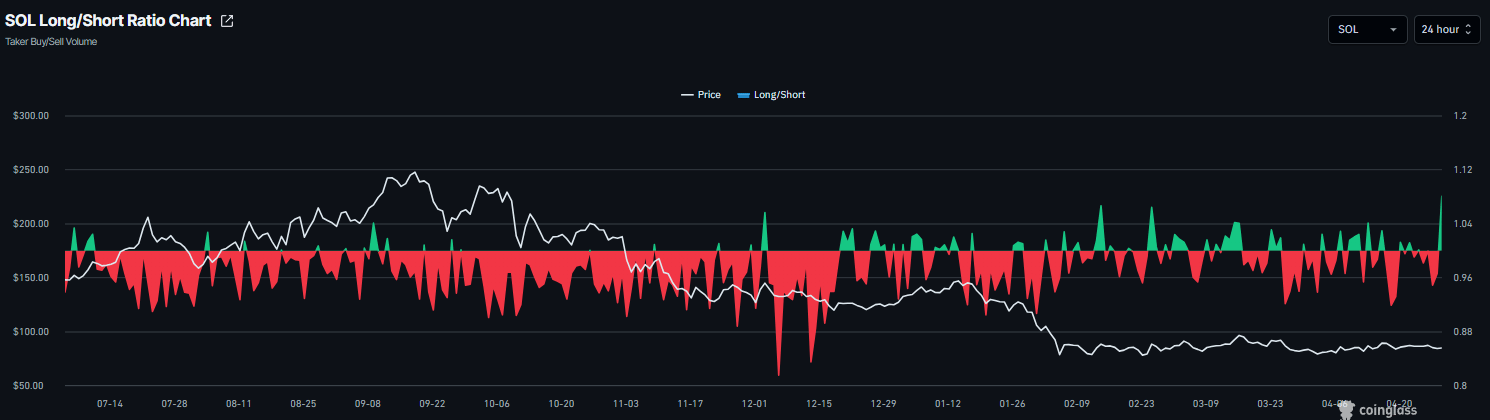
CoinGlass’ long-to-short ratio for SOL reads 1.08 on Wednesday, reaching its highest level in over a month. This ratio, being above one, reflects bullish sentiment in the market, as more traders are betting on the asset’s price to rise.
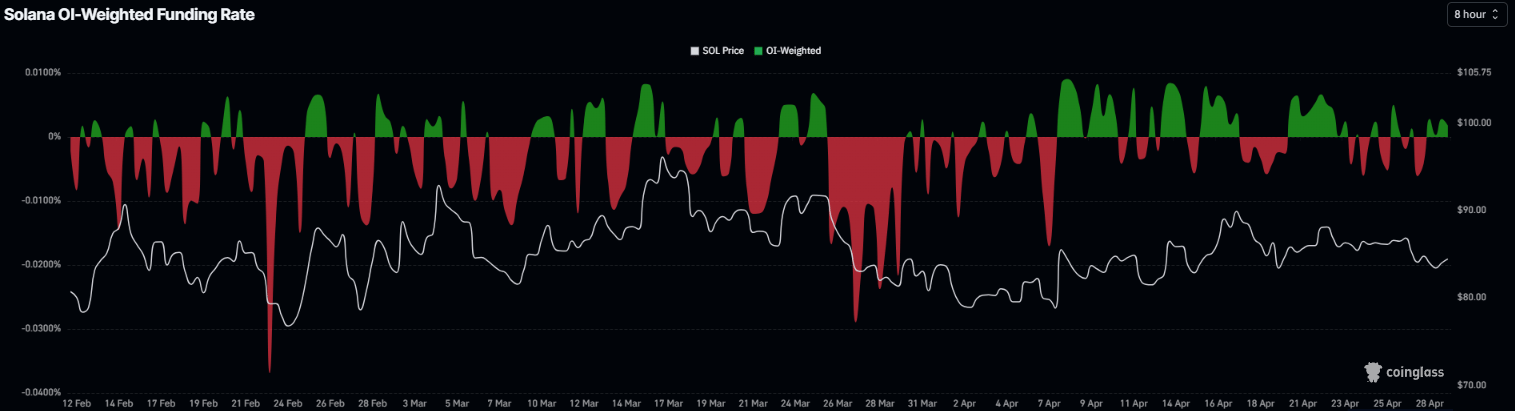
In addition, the funding rates also support a positive view. CoinGlass’ OI-Weighted Funding Rate data for Solana flipped positive on Tuesday and reads 0.0018% on Wednesday. This positive rate indicates that longs are paying shorts and projecting a bullish sentiment.
Moreover, Solana’s X post on Tuesday highlighted that its Real World Assets (RWAs) ecosystem hit a new all-time high (ATH) of $2.5 billion in total value, suggesting growing on-chain adoption and strengthening long-term outlook.
Some signs of concern
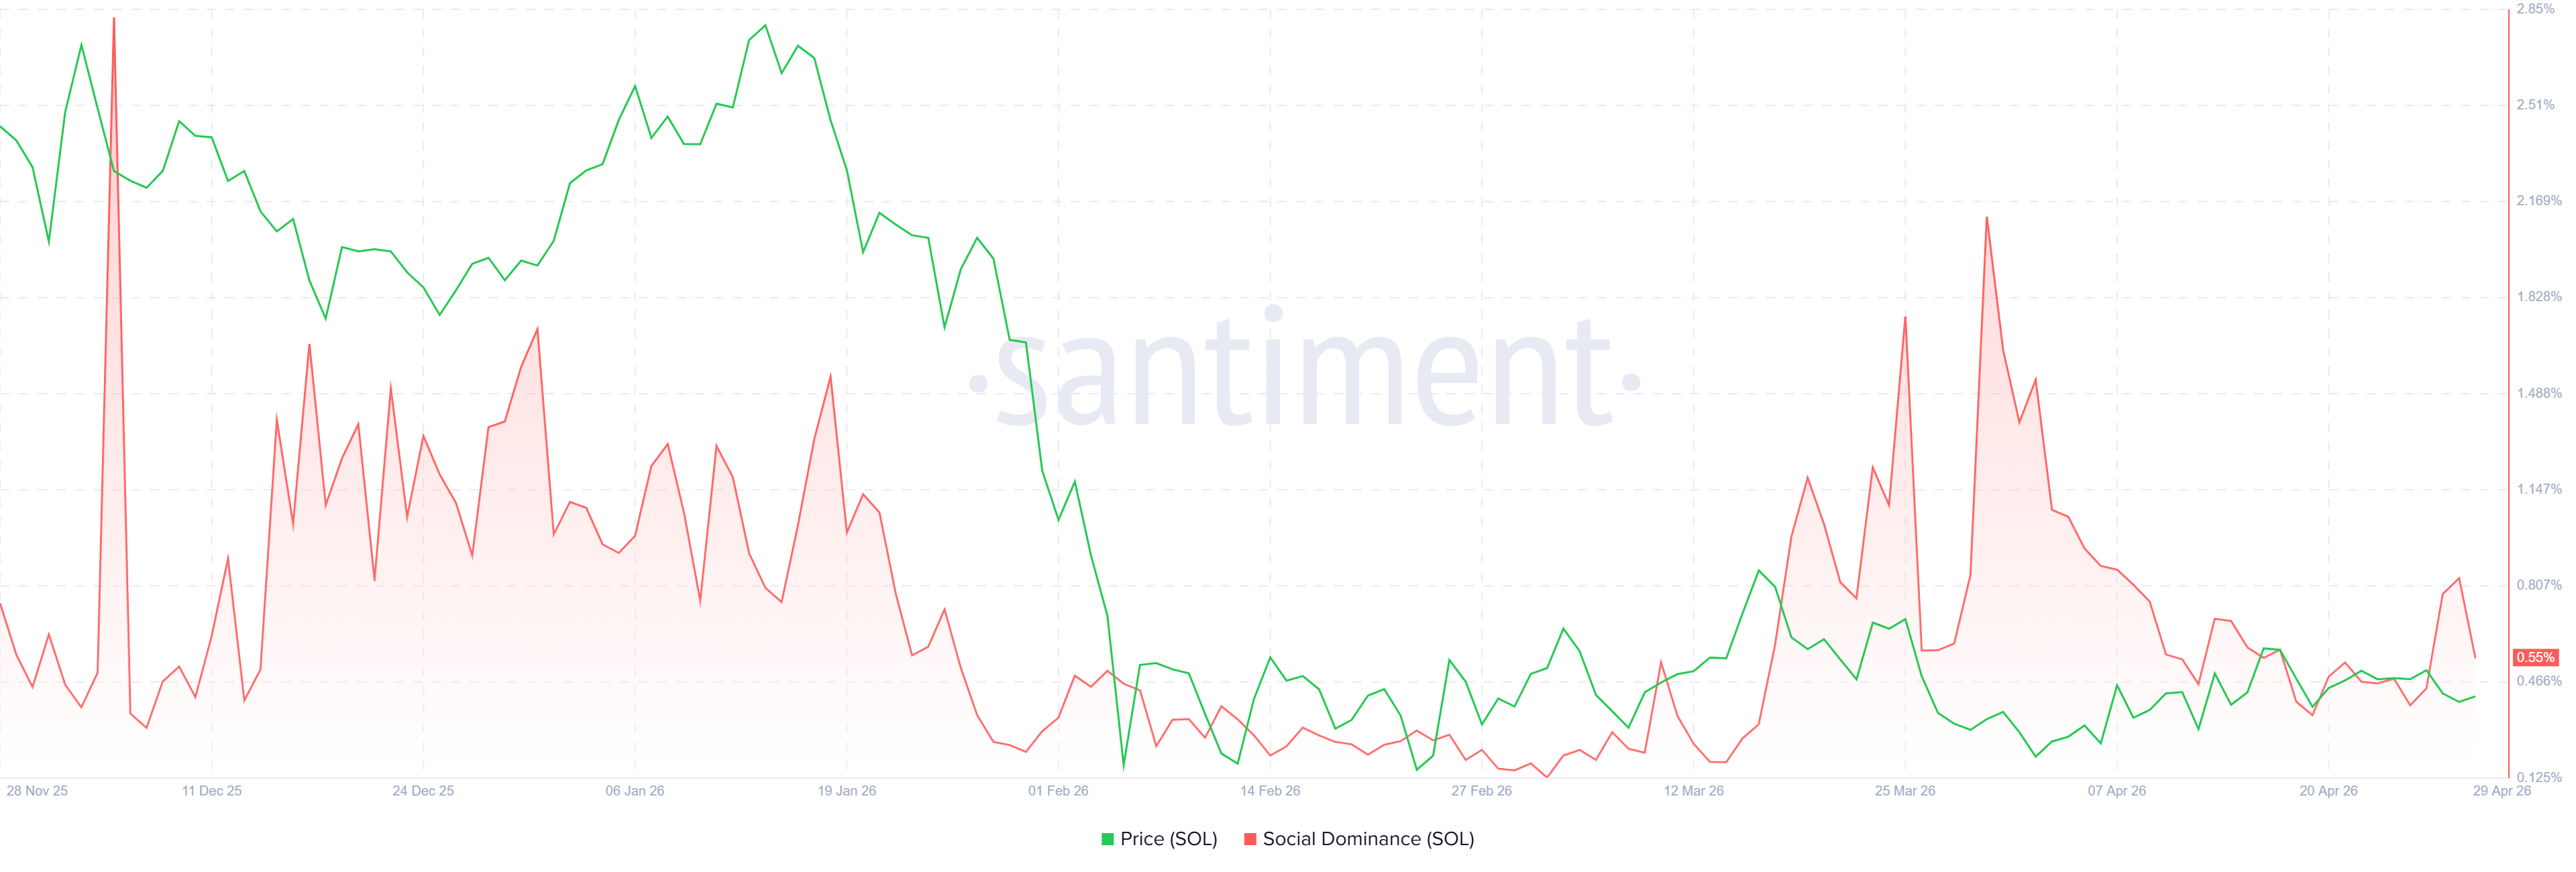
Santiment’s Social Dominance metric for Solana supports a bearish outlook. The index measures the share of SOL-related discussions across the cryptocurrency media. It fell sharply, reading 0.55% on Wednesday. This fall indicates fading market interest and weakening sentiment among SOL investors.
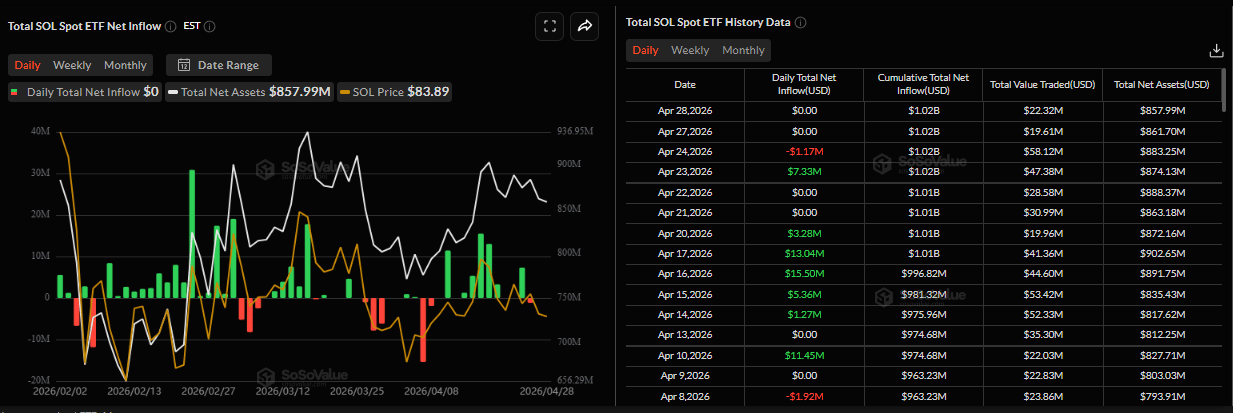
In addition, institutional demand, as shown in the chart below, has remained muted so far this week. SoSoValue data indicates that spot SOL Exchange Traded Funds (ETFs) have seen little to no activity. If these flows turn negative in the coming days, it could add further selling pressure and trigger a deeper correction in SOL price.
Solana Price Forecast: Fading bullish strength
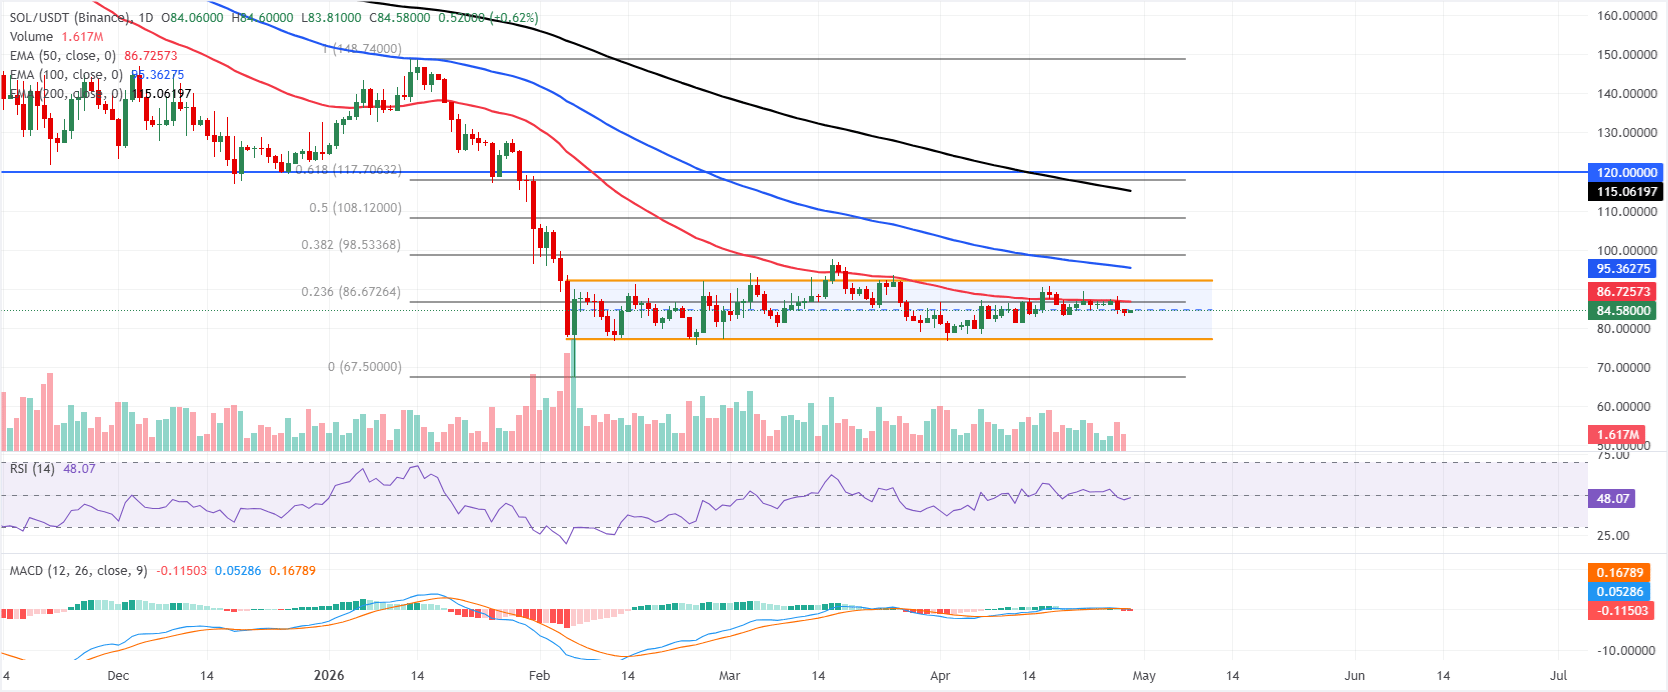
Solana price is trading at $84.58 on Wednesday, keeping a bearish near-term bias as price holds below the 50-day, 100-day and 200-day Exponential Moving Averages (EMAs) clustered well above the market, with the 50-day EMA capping near $86.72 and the 100-day and 200-day EMAs reinforcing overhead supply around $95.36 and $115.06, respectively.
SOL also trades beneath the 23.6% Fibonacci retracement of the latest swing at $86.67 and below the upper boundary of the parallel channel ceiling at $92.11, while the Relative Strength Index (14) is hovering near 48 and a slightly negative Moving Average Convergence Divergence (MACD) reading hints at waning upside momentum rather than an impulsive sell-off.
On the topside, immediate resistance is seen at the tight confluence of the 23.6% Fibonacci retracement at $86.67 and the 50-day EMA at $86.72, with further barriers at the channel top near $92.11 and the 100-day EMA around $95.36, ahead of the 38.2% retracement at $98.53 and the stronger band formed by the 50% retracement at $108.12, the 200-day EMA at $115.06 and the horizontal resistance line at $120.00.
On the downside, initial support emerges at the channel floor around $77.12, with the broader corrective floor aligned with the Fibonacci anchor at $67.50 if selling pressure accelerates.
(The technical analysis of this story was written with the help of an AI tool.)
Author

Manish Chhetri
FXStreet
Manish Chhetri is a crypto specialist with over four years of experience in the cryptocurrency industry.



