Meme Coins Price Prediction: DOGE extends gains, SHIB eyes breakout, PEPE tests resistance
- Dogecoin extends its gains on Monday after finding support around a key support level last week.
- Shiba Inu is near the upper boundary of its consolidation at $0.0000063, a breakout suggests a rally ahead.
- Pepe price approaches a crucial resistance level, where a firm close could extend gains.

Dogecoin (DOGE), Shiba Inu (SHIB) and Pepe (PEPE) are extending gains on Monday after recovering by over 6%, 5% and 6%, respectively, in the previous week. DOGE is pushing higher after rebounding from key support, SHIB is testing the upper boundary of its consolidation range, and PEPE is approaching a crucial resistance zone. A decisive breakout above these levels, with supporting bullish momentum, could trigger the next leg of upside for these meme coins.
Dogecoin holds above key support
Dogecoin price is extending its gains, trading above $0.100 on Monday after surging over 6% and holding above the key 50-day Exponential Moving Average (EMA) at $0.096.
If DOGE continues its upward move, it could extend the rally toward the 100-day EMA at $0.104.
The Relative Strength Index (RSI) on the daily chart reads 61, above the neutral level of 50 and below the overbought threshold, indicating bullish momentum. Moreover, the Moving Average Convergence Divergence (MACD) indicator on the same chart shows green histogram bars, supporting the positive outlook.
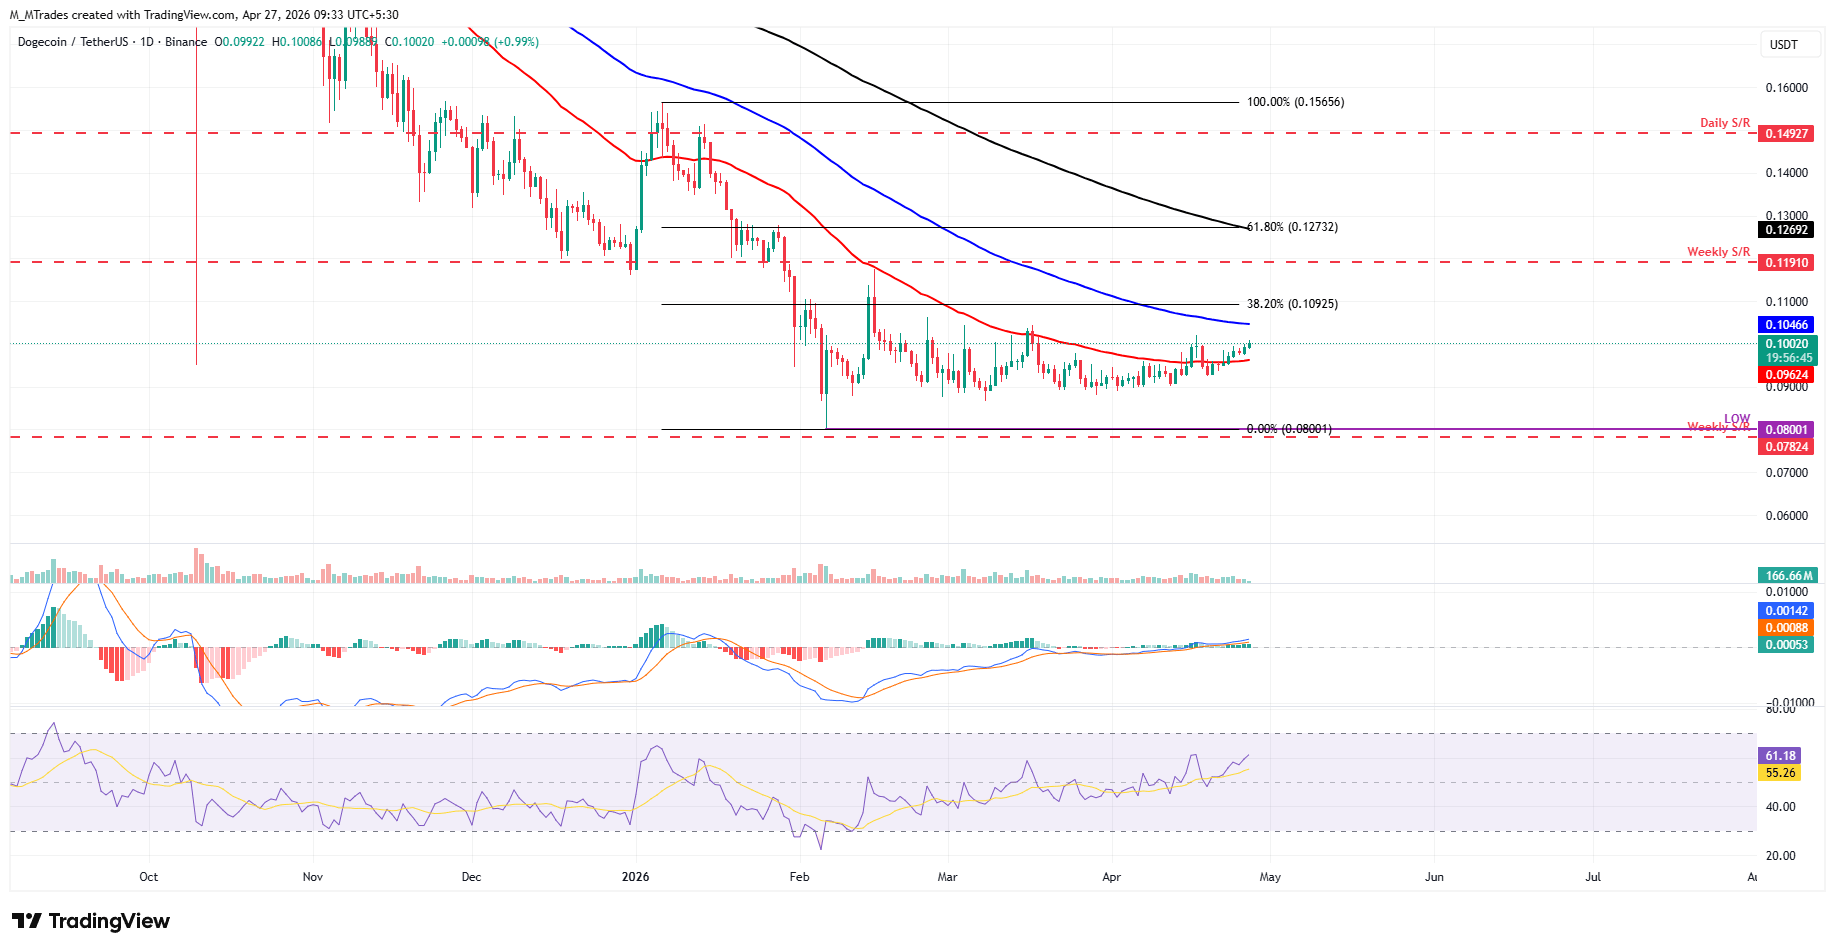
However, if DOGE faces a correction, it could extend the decline toward the 50-day EMA at $0.096.
Shiba Inu nears upper consolidation boundary
Shiba Inu price is approaching the upper consolidation boundary at $0.0000063 on Monday, after surging by over 5% in the previous week.
If SHIB closes above this upper boundary on a daily basis, it could extend the rally toward the weekly resistance at $0.0000068.
Like Dogecoin, SHIB’s RSI and MACD momentum indicators support a slight positive bias.
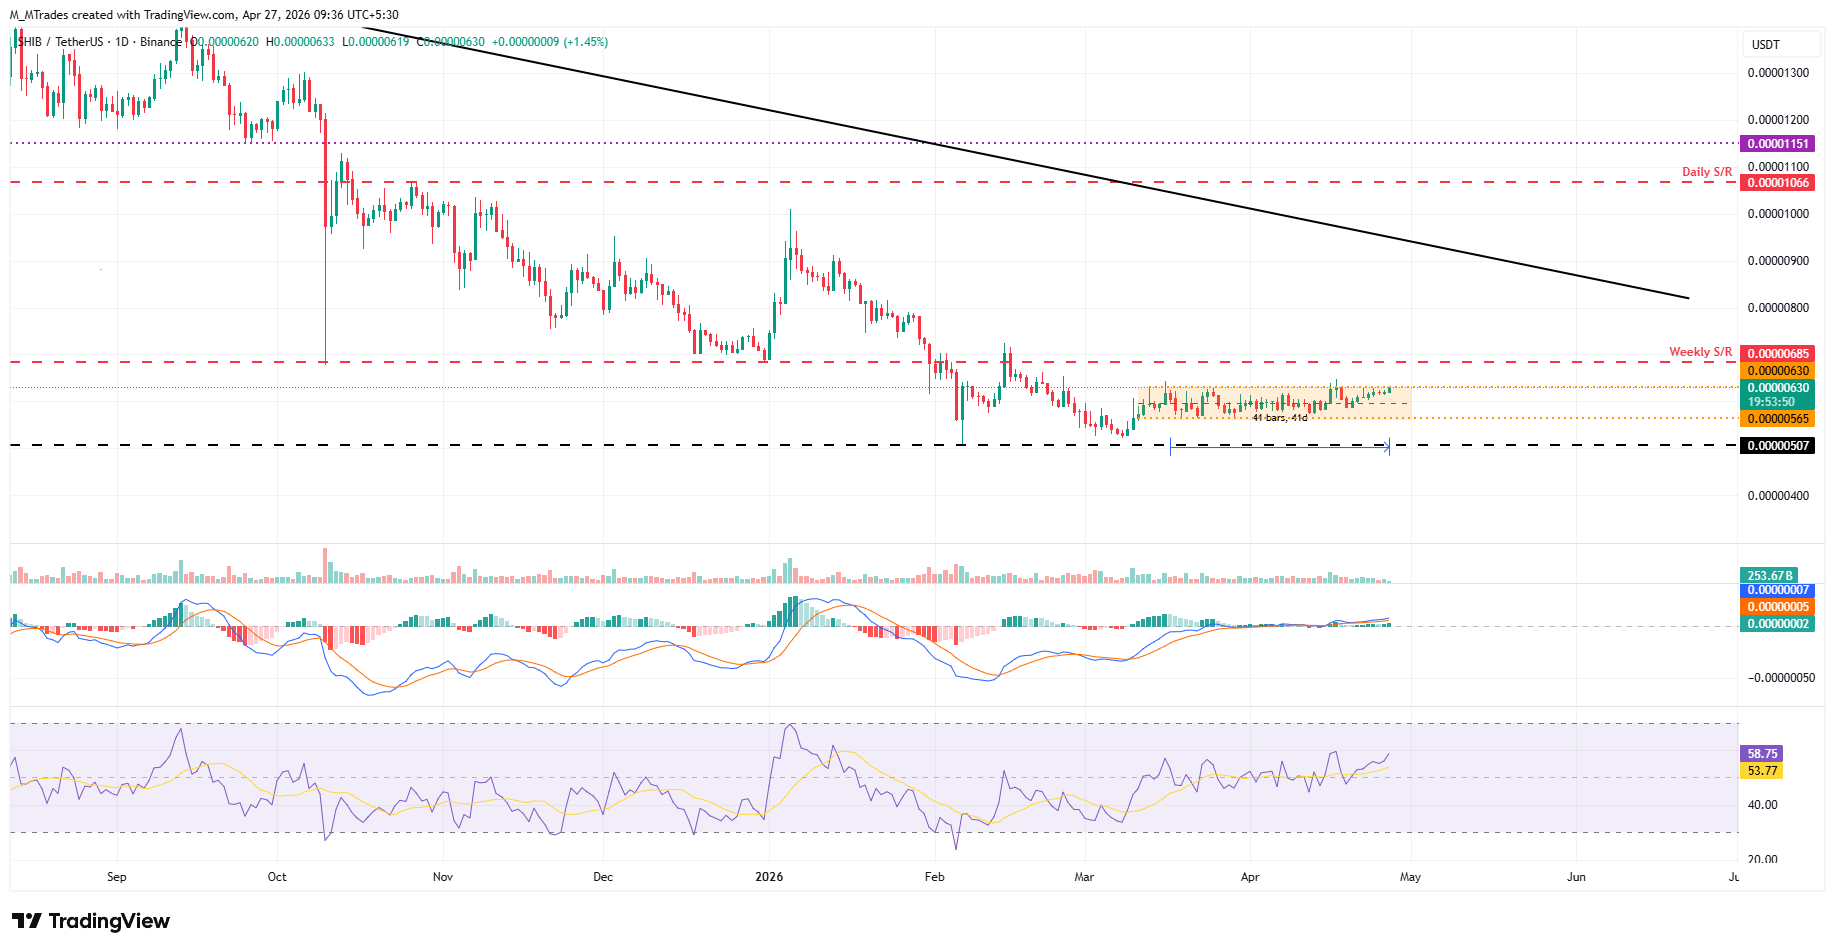
If SHIB faces rejection and corrects, it could extend the decline toward the lower channel range at $0.0000056.
Pepe could extend gains if it closes above the 100-day EMA
Pepe price is approaching the key 100-day EMA resistance at $0.0000040 on Monday after finding support and rebounding 6% from its previously broken 50-day EMA at $0.0000037 last week.
If PEPE closes above the $0.0000040 on a daily basis, it could extend the rally toward the 200-day EMA at $0.0000050, which roughly coincides with the daily resistance.
Like Dogecoin and Shiba Inu, Pepe’s momentum indicators (RSI and MACD) also support a mild bullish outlook.
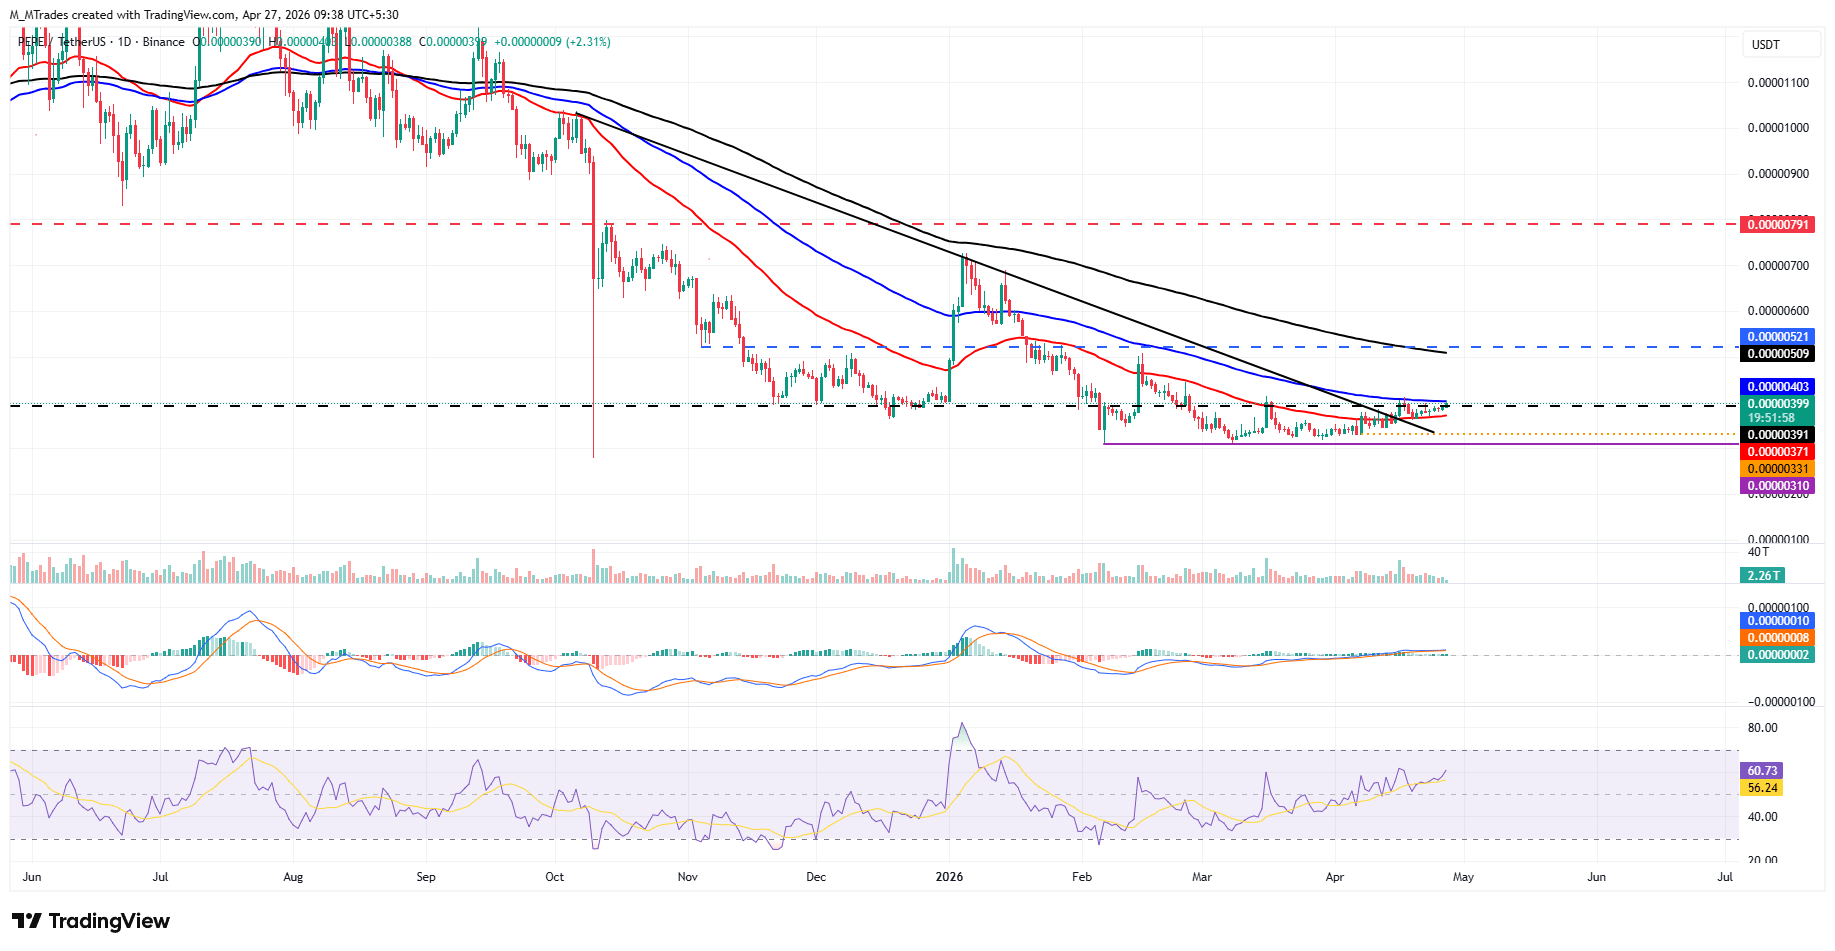
On the other hand, if PEPE faces a pullback, it could extend the decline toward the 50-day EMA at $0.0000037.
Author

Manish Chhetri
FXStreet
Manish Chhetri is a crypto specialist with over four years of experience in the cryptocurrency industry.



