Solana Price Forecast: SOL risks further losses as key support wobbles, retail demand wanes
- Solana is down over 6% on Monday, putting pressure on the $174-$177 support zone and a local support trendline.
- The retail interest in Solana is low as futures Open Interest and funding rates decline.
- The spot market's outflows and positive weekly inflows of spot SOL ETFs from last week spark hopes of a rebound.

Solana (SOL) price is down over 6% at press time on Monday, pressuring the $174-$177 support zone after reversing from the 200-day Exponential Moving Average (EMA). The derivatives data suggest a bearish incline among traders anticipating further losses.
Still, the outflows from the spot market and the inflows of the last week in the US spot SOL Exchange Traded Funds (ETFs) keep the rebound chances on the table.
Sellers dominate the SOL derivatives
Solana is losing the retail interest as the broader market volatility dulls the risk appetite of traders. CoinGlass data shows that SOL futures Open Interest (OI) has decreased by 1.56% over the last 24 hours to $10.16 billion, indicating a decline in leverage for open futures contracts or traders closing positions.
Additionally, the OI-weighted funding rate is at -0.0078% suggesting bearish incline among traders, who are paying a premium to hold short positions.
On a more negative note, the long liquidations of $43.10 million in the last 24 hours outpace the $1.90 million in short liquidations, indicating a larger wipeout of bullish-aligned traders. This imbalance has dropped the active long/short positions ratio to 0.9102 in the same time period, suggesting a greater number of active short positions.
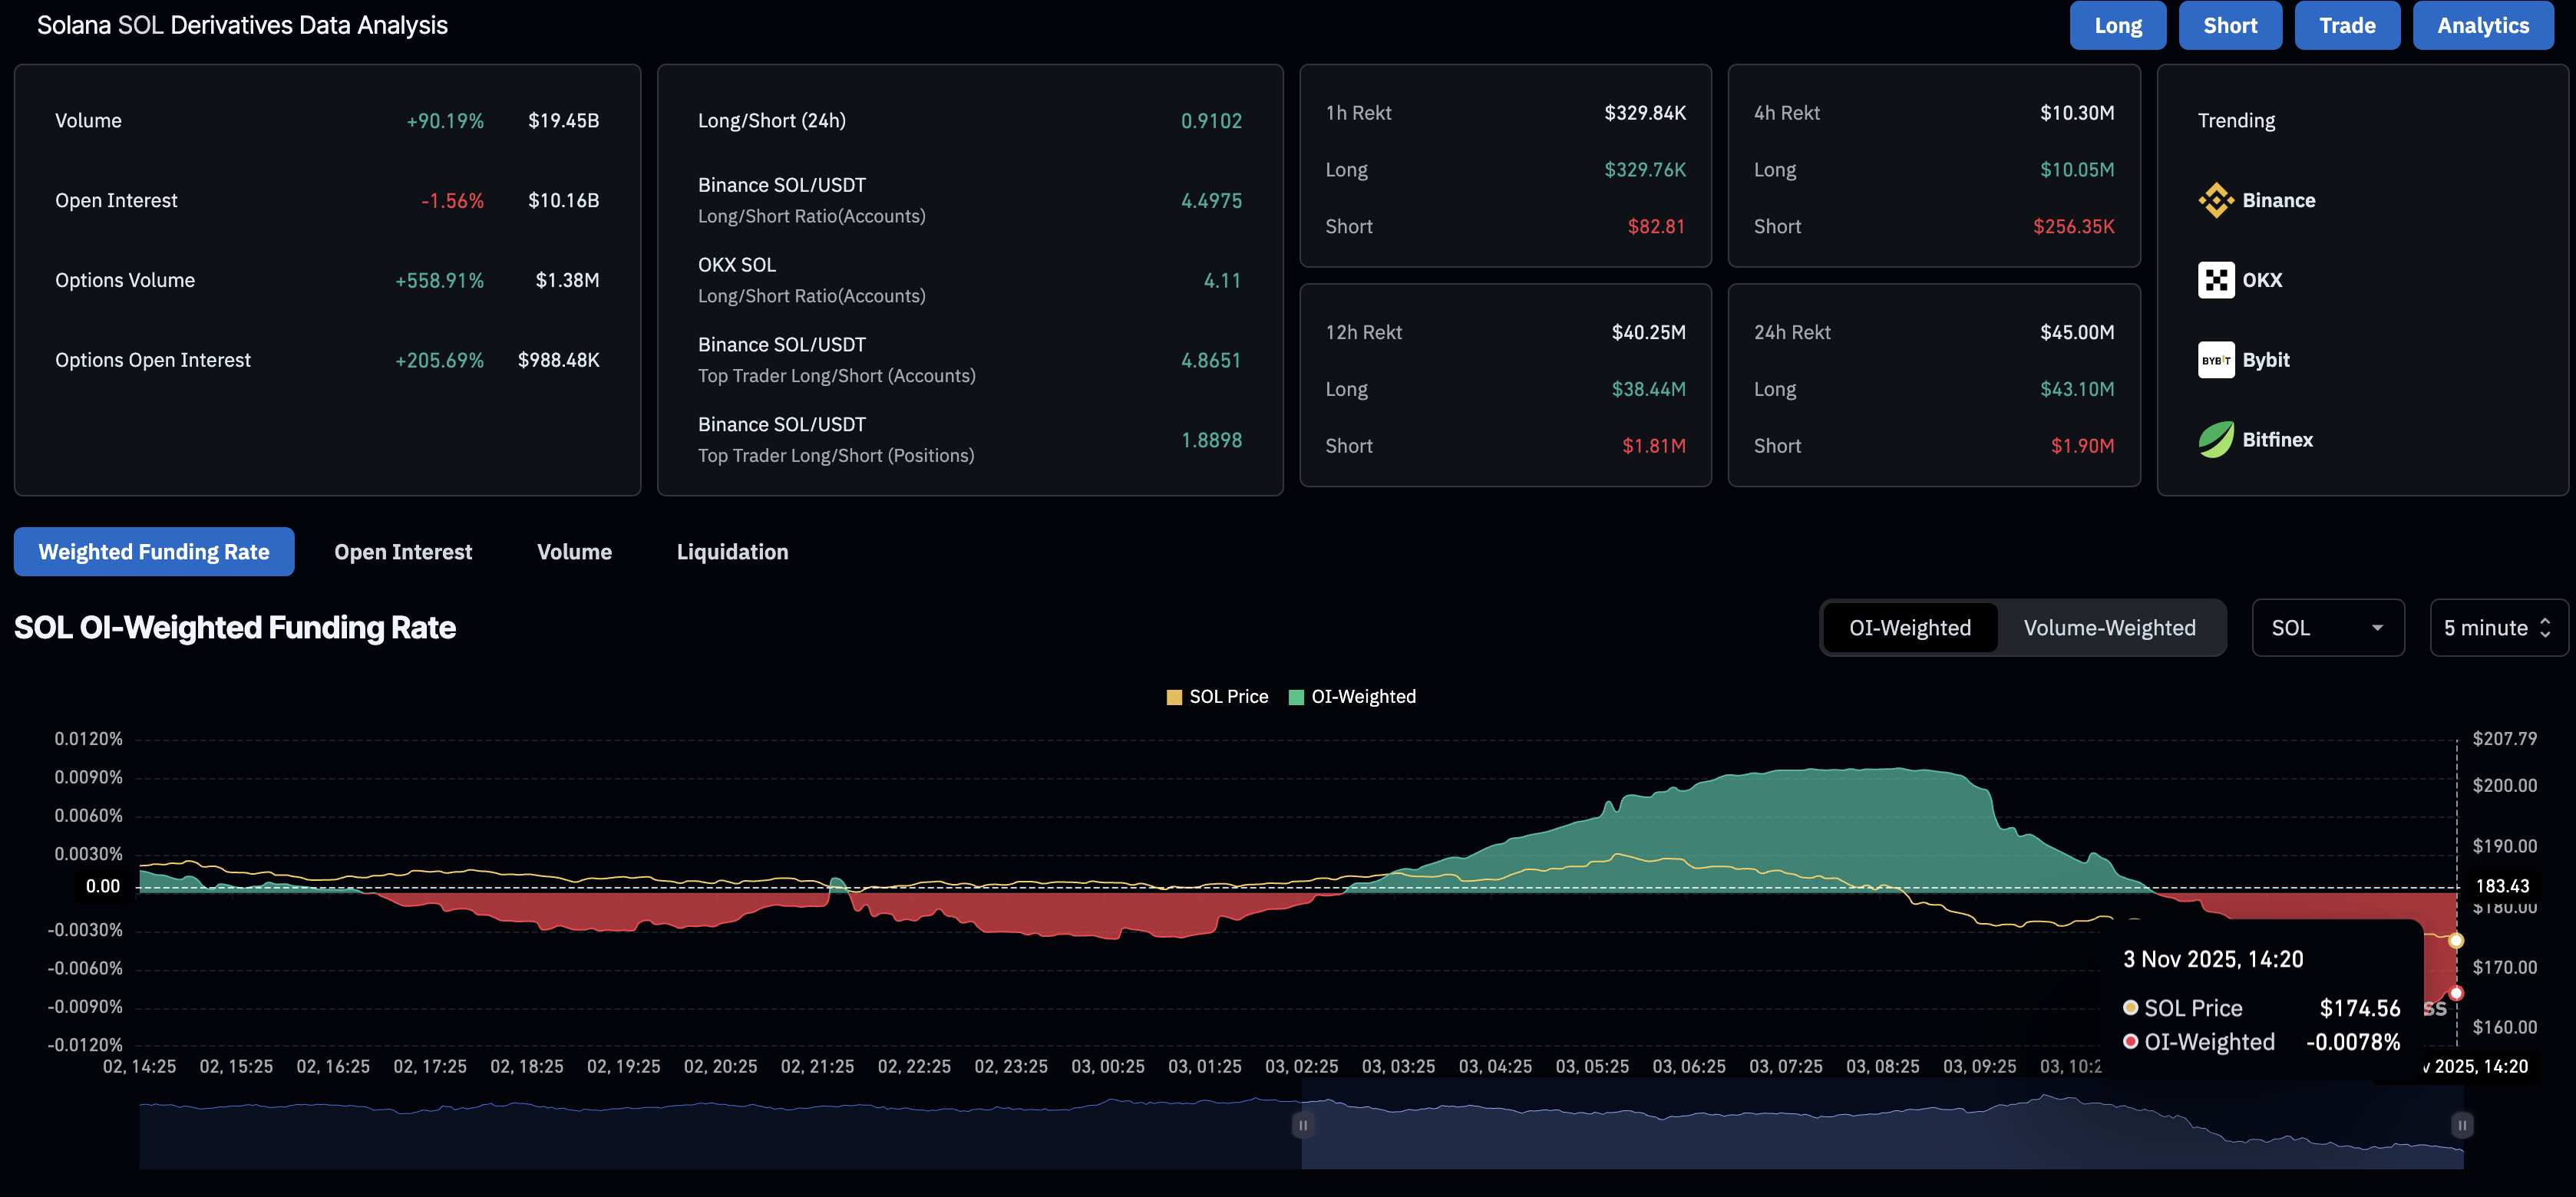
SOL derivatives data. Source: CoinGlass.
Solana risks crashing below key support elements
Solana trades at $175 by press time on Monday, after an over 6% intraday loss, risking the $174-$177 demand zone and a support trendline formed by connecting the July 1 and October 10 lows.
A decisive close below $174 would confirm the breakdown, risking a further decline to the $153-$156 support zone, which would account for nearly a 10% drop from the current market price.
Furthermore, Solana trades below the 200-day EMA, while the downward shift in 50-day and 100-day EMAs risks a Death Cross pattern. This would flash a sell signal as the short-term bearish trend gains strength.
The momentum indicators on the daily chart signal an impending bearish shift as the Moving Average Convergence Divergence (MACD) converges with the signal line. If MACD extends the decline below the signal line, it would confirm a rise in bearish momentum.
At the same time, the Relative Strength Index (RSI) at 37 experiences a sharp downside move, suggesting a rise in selling pressure. The further room on the downside, before reaching the oversold zone, indicates more space for correction.
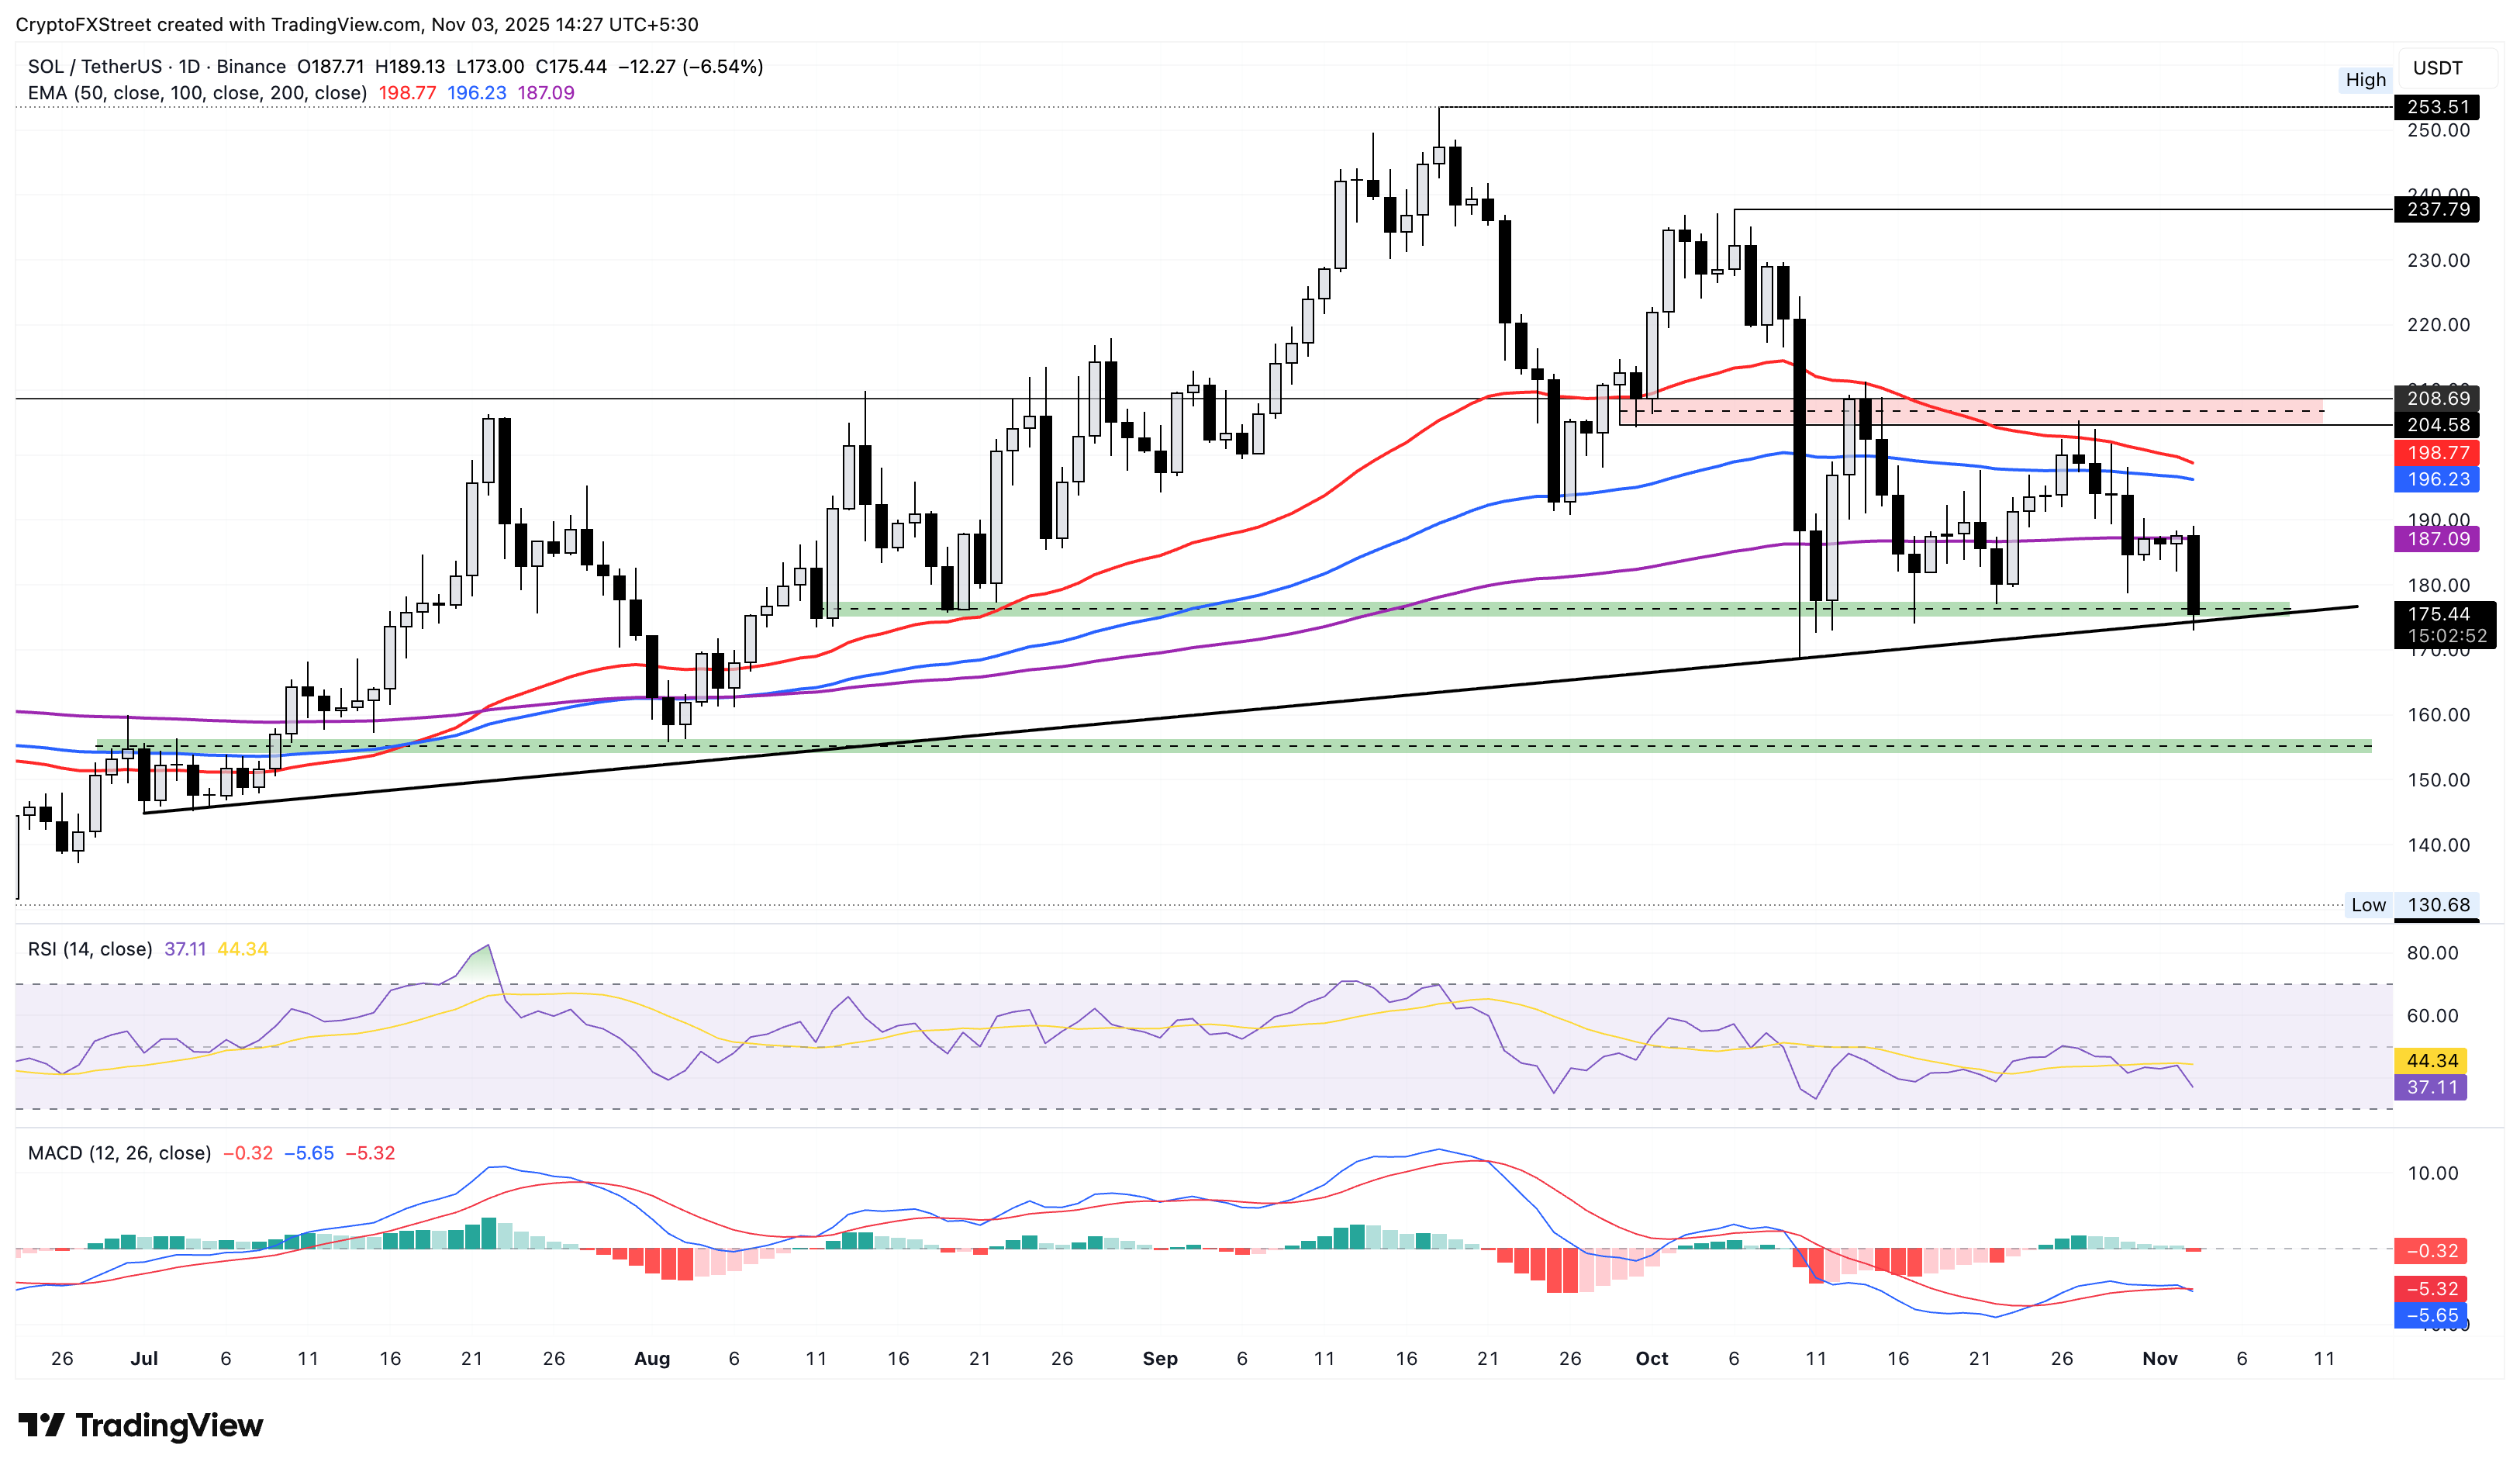
SOL/USDT daily price chart.
On the flip side, a rebound in SOL from $175 could retest the 200-day EMA at $187.
Could Solana trap the bears?
Despite the waning retail demand keeping SOL on the edge, the launch of the US spot Solana ETFs last week shows steady institutional demand for Ethereum’s top competitor. Sosovalue data shows four consecutive days of inflows last week, amounting to $199.21 million for the week ending October 31. If the steady trend continues this week, demand from institutional players could lift SOL prices.
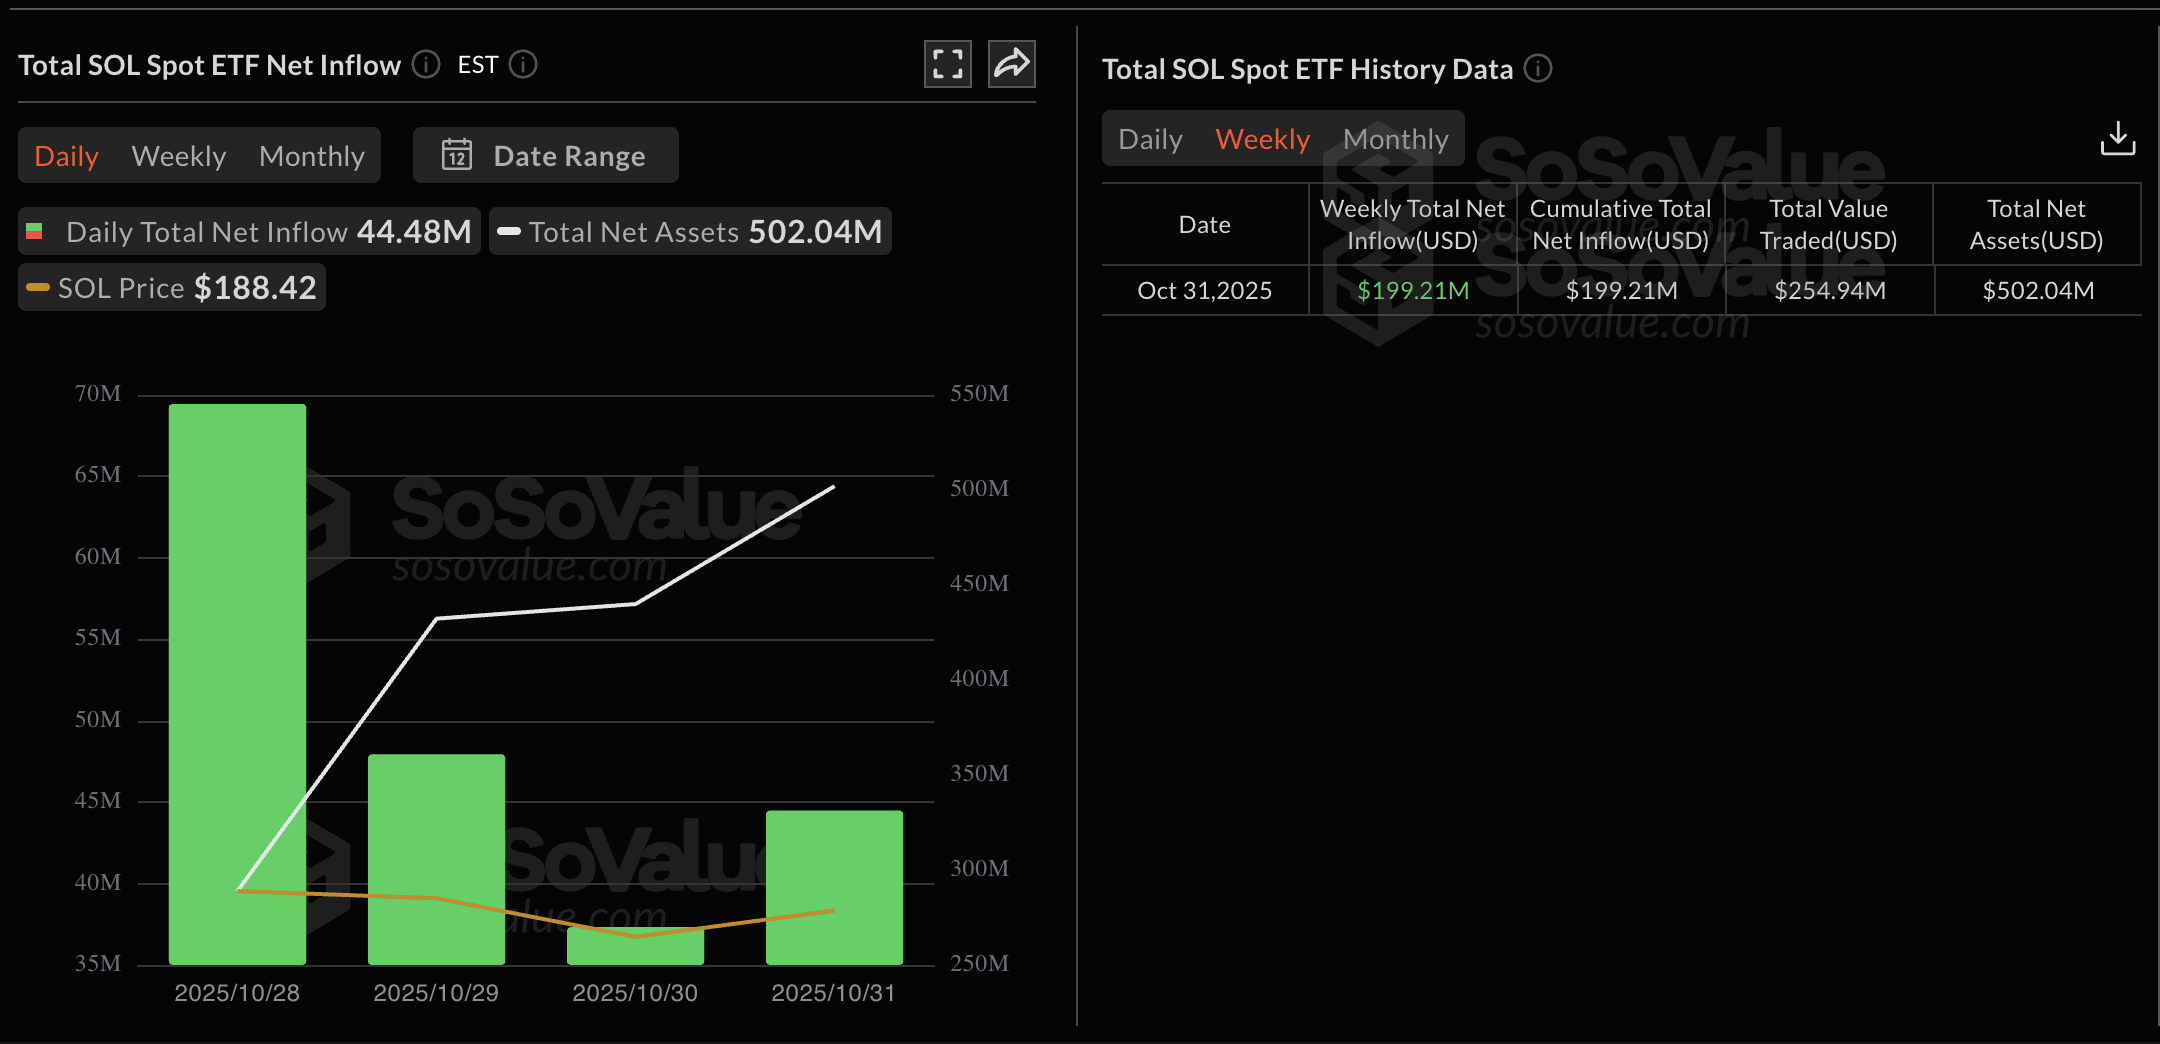
US SOL spot ETFs inflows. Source: Sosovalue.
Adding more buffer, the intraday netflows in the spot market show a net outflow of $75.76 million worth of Solana so far on Monday. This indicates that traders are either capitalizing on discounted prices or shifting tokens from exchanges to cold storage, reflecting confidence in Solana.
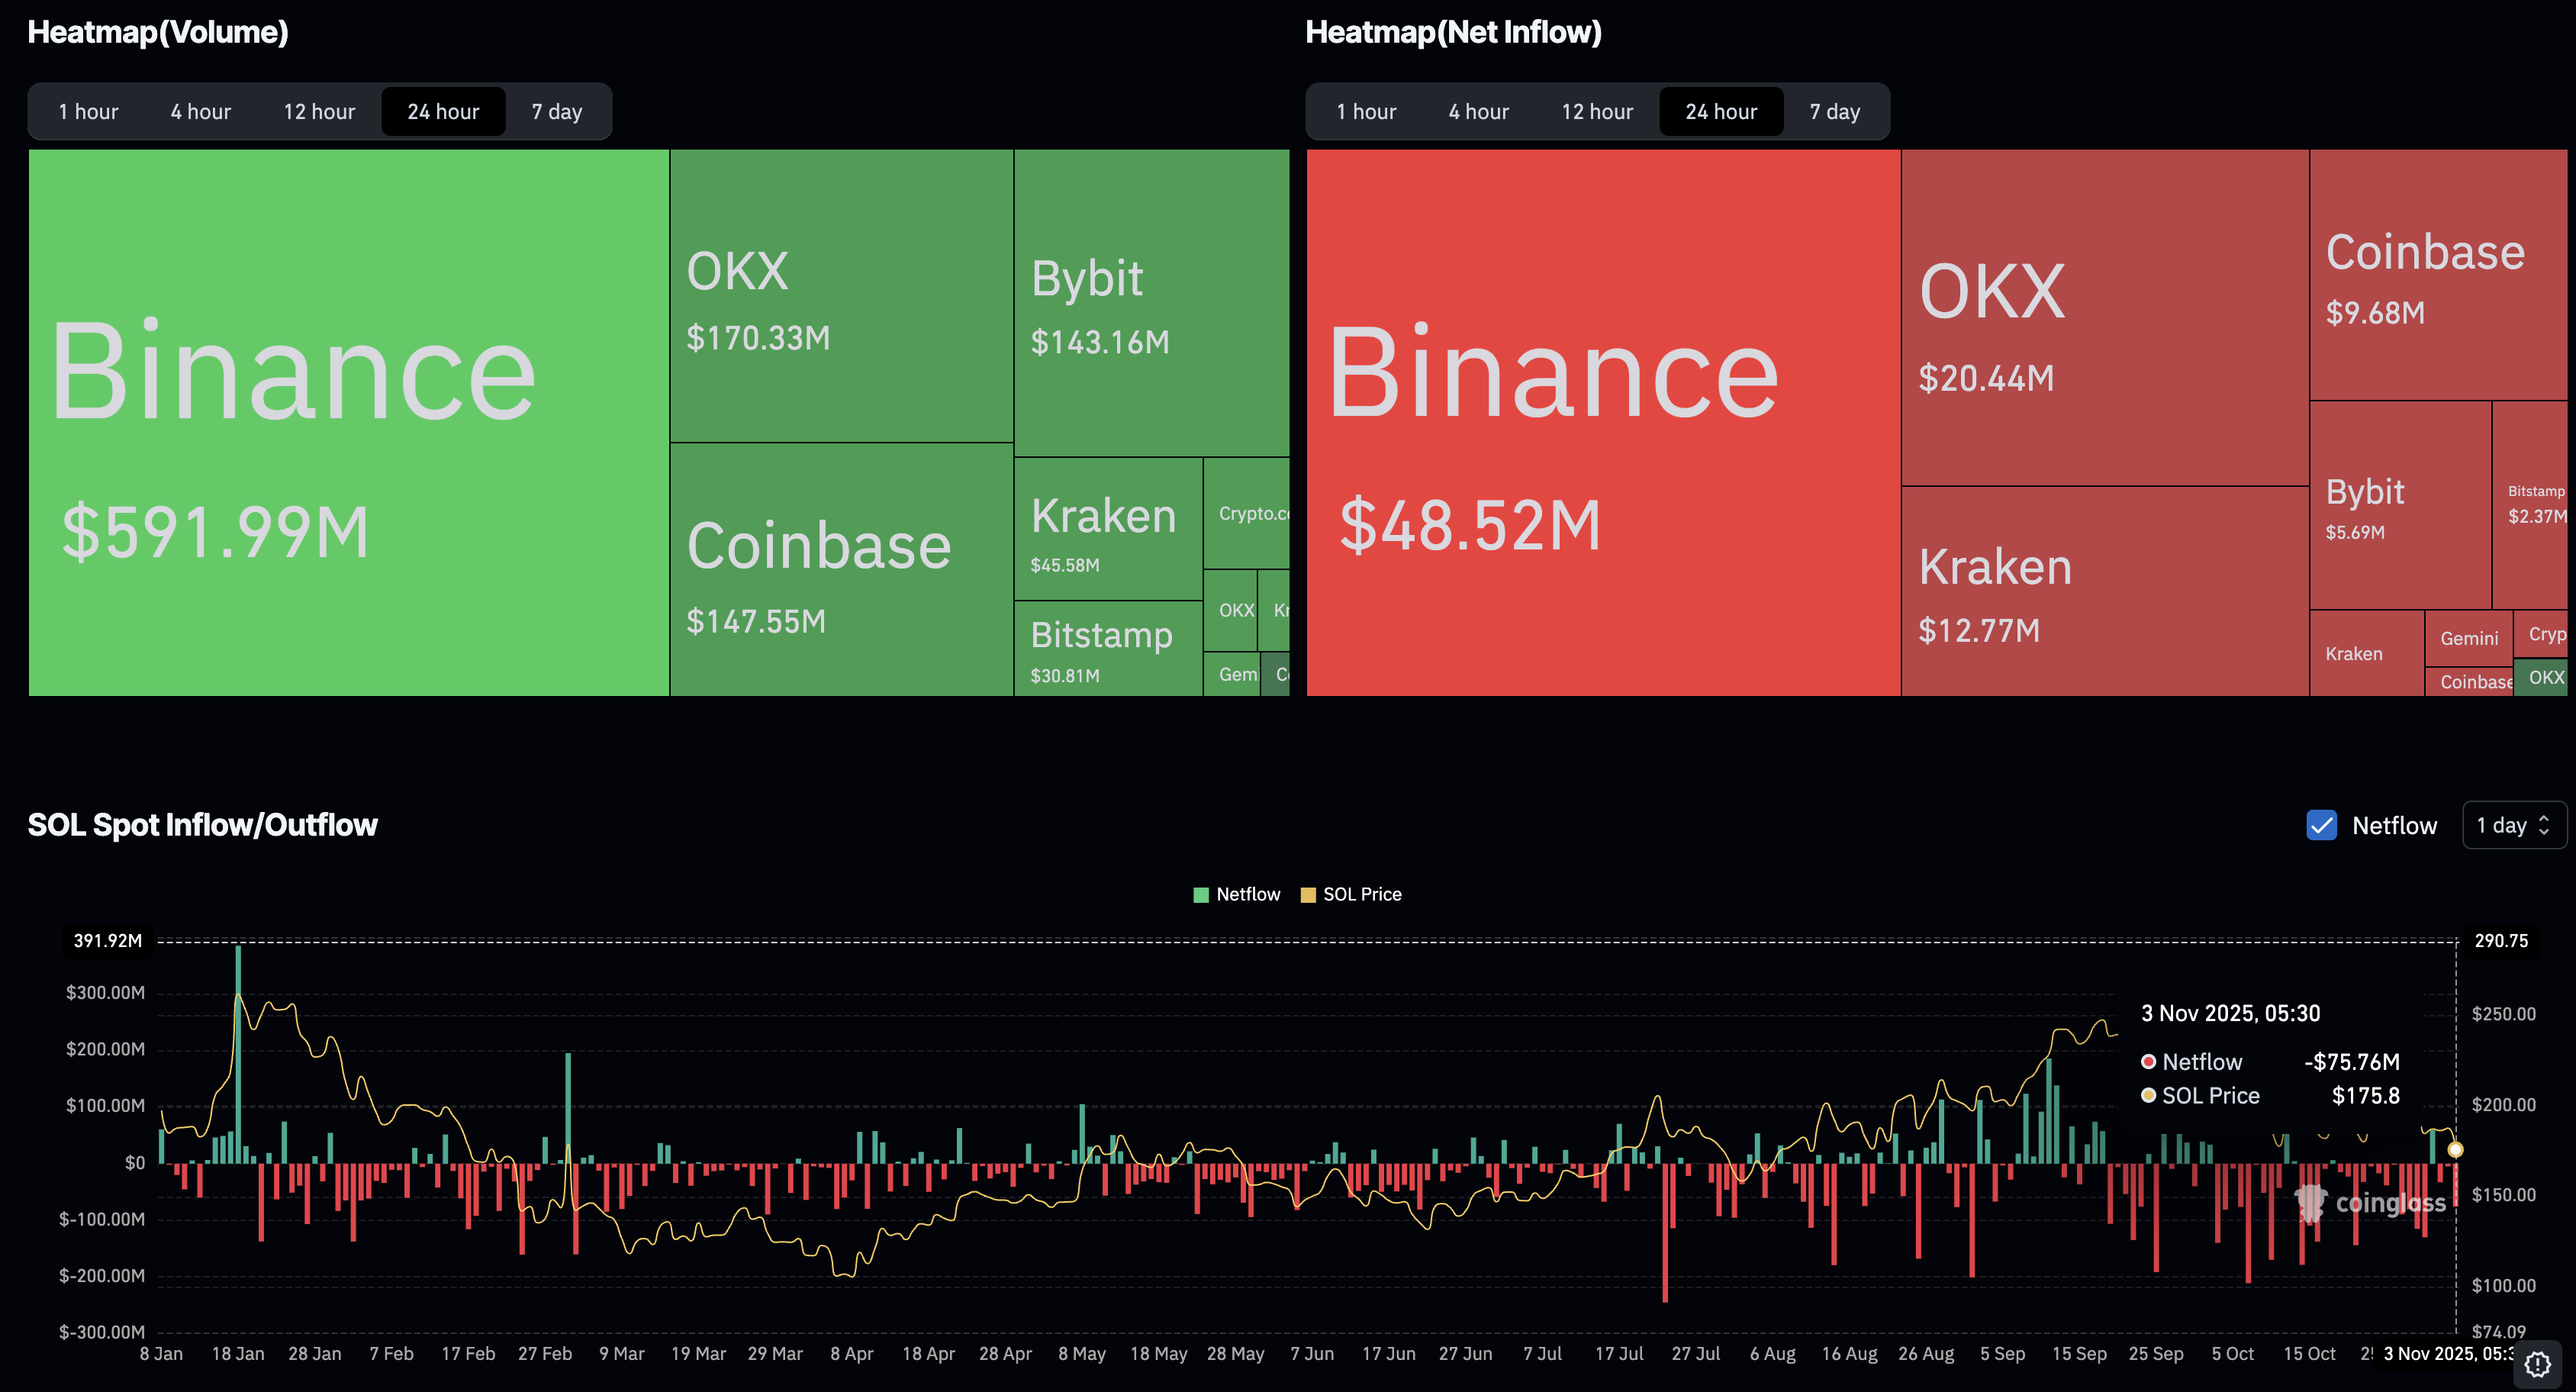
SOL spot netflows. Source: CoinGlass.
In a nutshell, Solana stands at a crossroads amid intense broader market volatility, which could shake out traders on both sides of the bet. To avoid short-term losses, traders might consider waiting for a decisive close to the day before opening a short position.
Author

Vishal Dixit
FXStreet
Vishal Dixit holds a B.Sc. in Chemistry from Wilson College but found his true calling in the world of crypto.


