Solana Price Forecast: SOL could take a breather and pullback 30% after a 600% bull rally
- Solana price shows signs of bullish exhaustion after a 600% bull rally in less than 35 days.
- The Tom DeMark Sequential has presented a sell signal in the form of a green nine candlestick suggesting that a correction could follow.
- A failure of the demand barrier at $14.82 could extend the pullback to the 61.8% Fibonacci retracement level.

Solana price has been on an uptrend since January 22 with only minor corrections. SOL was surprisingly unbothered during the market crash on February 22 and 23, as it dropped by a mere 13%.
Solana price at an inflection point
Solana price saw a 75% upswing since the market crash on February 22. Now, the Tom DeMark (TD) Sequential indicator has flashed a sell signal in the form of a green nine candlestick on the 6-hour chart. This technical formation forecasts a one to four candlestick correction.
At the time of writing, the second red candlestick was underway, indicating a follow-through. Interestingly, SOL saw an average correction of 15% the last five times this indicator flashed a sell signal.
Hence, it is safe to assume that this correction could extend anywhere between 15% to 30%. A 15% correction would put SOL at $14.8 or the 78.6% Fibonacci retracement level. However, if the selling pressure piles up, the correction could drag Solana price to $12.2 or the 61.8% Fibonacci retracement level.
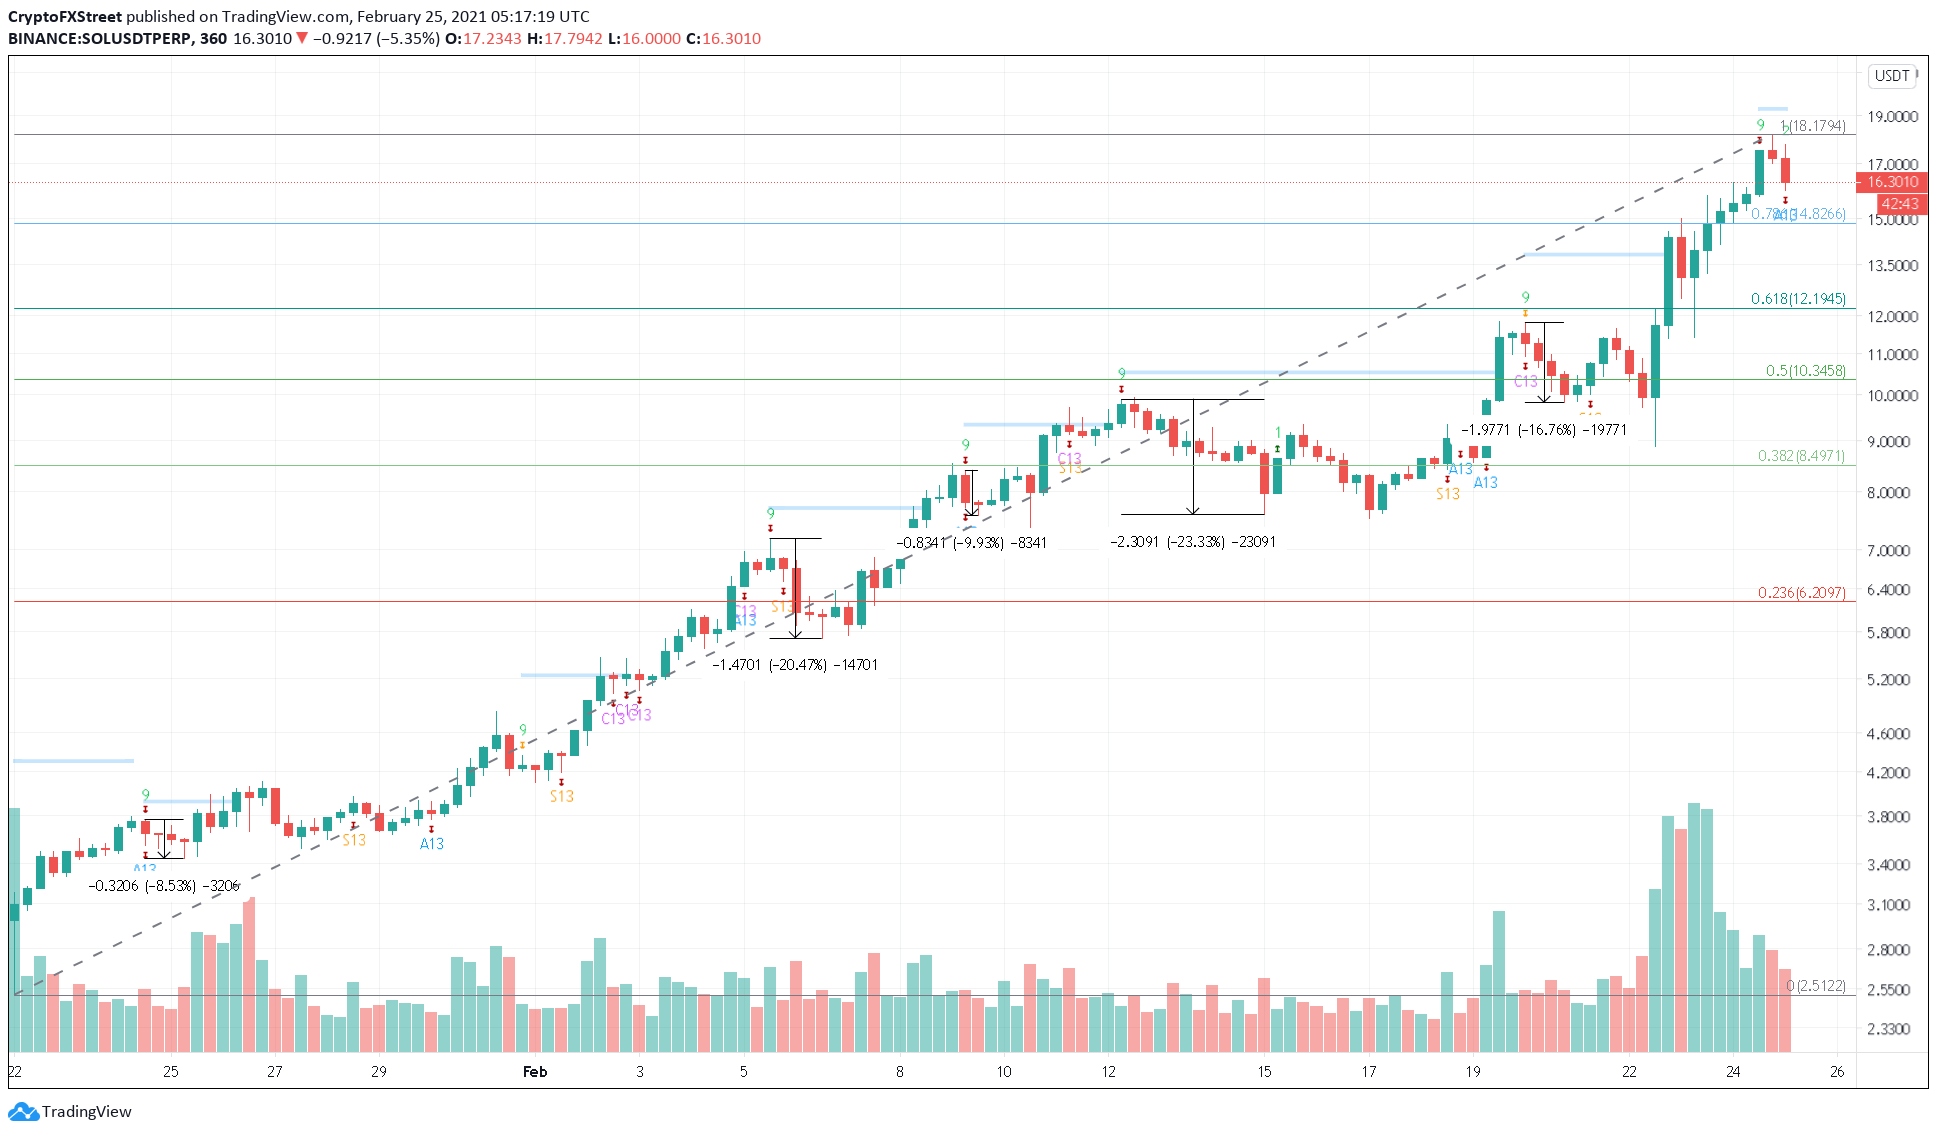
SOL/USDT 6-hour chart
Regardless of the bearish indications, investors should note that a bounce from the immediate supply barrier at $14.8 is plausible.
However, a build-up of buyers around this level could result in a volatile upswing of Solana price towards an all-time high at $18.18 or $22.44, which coincides with the 127.2% Fibonacci retracement level.
Author

Akash Girimath
FXStreet
Akash Girimath is a Mechanical Engineer interested in the chaos of the financial markets. Trying to make sense of this convoluted yet fascinating space, he switched his engineering job to become a crypto reporter and analyst.