Solana Price Analysis: SOL plunges as ETF speculators bet billions on XRP and DOGE
- Solana price tumbles as low as $180 on Monday, down over 9% since the US SEC acknowledged XRP and DOGE ETFs fillings on Friday
- Bears dominate the SOL derivatives markets with $400 million active short contracts dwarfing $138 million long positions.
- Technical analysis indicators suggest SOL price remains at risk of further downsizing.

Solana (SOL) price tumbles as low as $180 on Monday, down over 9% in three consecutive days of losses. Bearish dominance in the SOL derivatives markets suggests the downtrend could extend in the week ahead.
Solana (SOL) plunges 9% as ETF speculators switch focus to XRP and DOGE
Solana (SOL) negative performance in February has extended further as the bearish price action intensified over the weekend.
Notably, the onset of Solana’s latest downtrend coincided with news of the US Securities and Exchange Commission (SEC) acknowledging Grayscale’s ETF filings for Ripple (XRP) and Dogecoin (DOGE) on Friday.
As short-term traders reacted to the news by mounting demand for both XRP and DOGE, it dampened momentum for other major altcoins with ETF filings in progress, including Litecoin (LTC) and Solana (SOL).

The chart above shows that the SOL price has been in a steep downtrend since Saturday. SOL price has booked three consecutive days of losses since the SEC acknowledged DOGE and XRP ETFs fillings, declining over 9%. This brings Solana’s losses for February towards the 25% mark at press time on Monday.
Bears are betting $400 million leverage on further SOL downswings
The short-term impact of the SEC move on the altcoin markets has evidently been pivotal to Solana’s three-day losing streak, which saw it decline over 9% from $200 on Saturday to $182 at press time on Monday.
However, a closer look at SOL derivatives market metrics suggests that most traders anticipate further losses in the week ahead.
The Coinglass Liquidation Map chart below also emphasizes this stance, showing active leverage short vs. long positions mounted around the 20% boundaries of the current Solana prices.
This helps provide insights into how most short-term speculative traders are leaning during specific market phases.
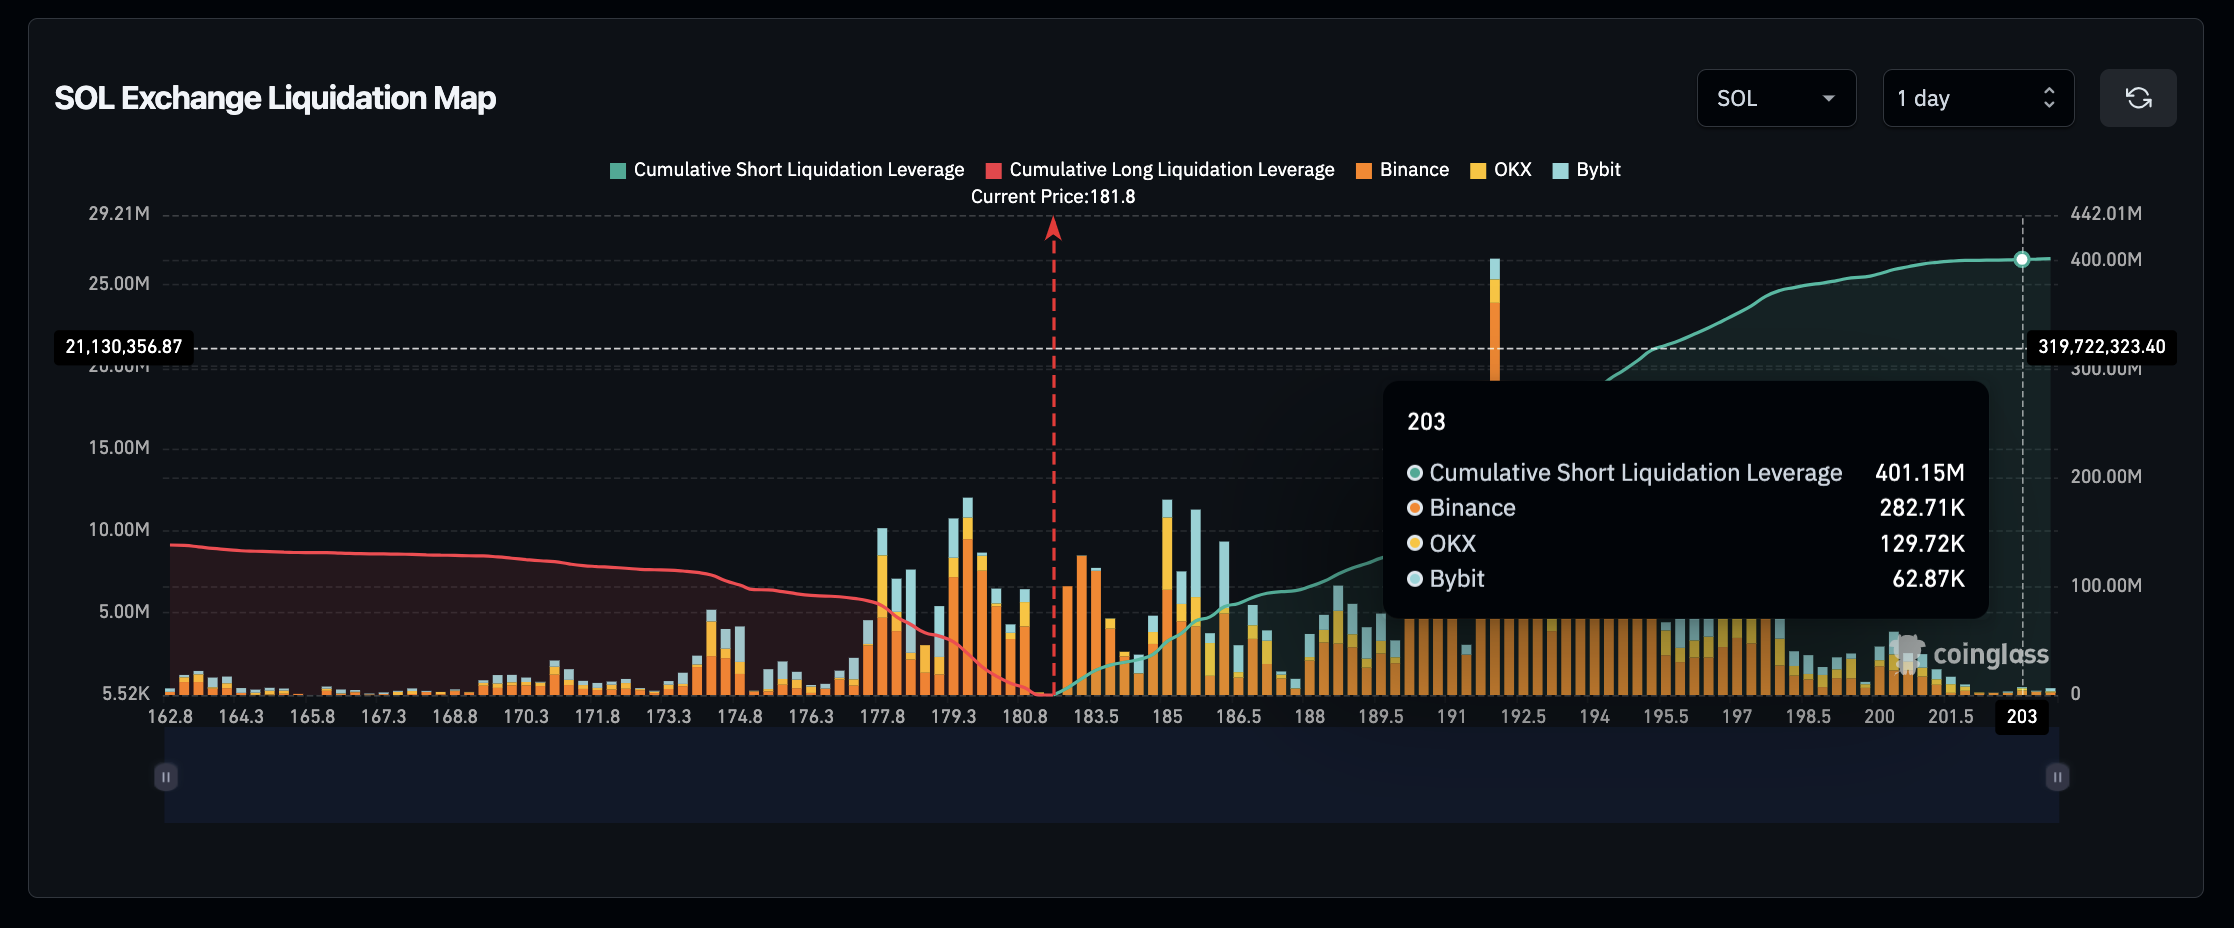
The chart above shows active short contracts worth $400 million against long positions that have dwindled to $138 million.
This signals that bears currently maintain 65% dominance within the Solana derivatives market. It suggests that after three consecutive days of losses, most bull traders are now losing confidence and opting to capitulate rather than cover their positions.
Short positions outpacing longs can be indicative of a prolonged downtrend.
On the flip side, with short traders now over-leveraged, bulls may keep an eye on a slim breakout chance if markets receive a major bullish sentiment boost as the week unfolds.
By catching the overleveraged bears unawares, a short squeeze could drive up prices rapidly.
Solana Price Forecast: Bears eyes $175 as downward momentum intensifies
Solana’s price action is tilting bearish as it hovers near $182, extending its recent downtrend.
The daily chart highlights a 24% decline so far in February, with bears tightening their grip following the SEC’s acknowledgment of ETF filings for XRP and DOGE.
The parabolic SAR dots above the price candles indicate a strong bearish trend, reinforced by SOL’s persistent struggle below the 50-day Simple Moving Average (SMA) at $212.09 and the 21-day SMA at $216.70.
This suggests mounting selling pressure, with resistance levels stacking above the current price.
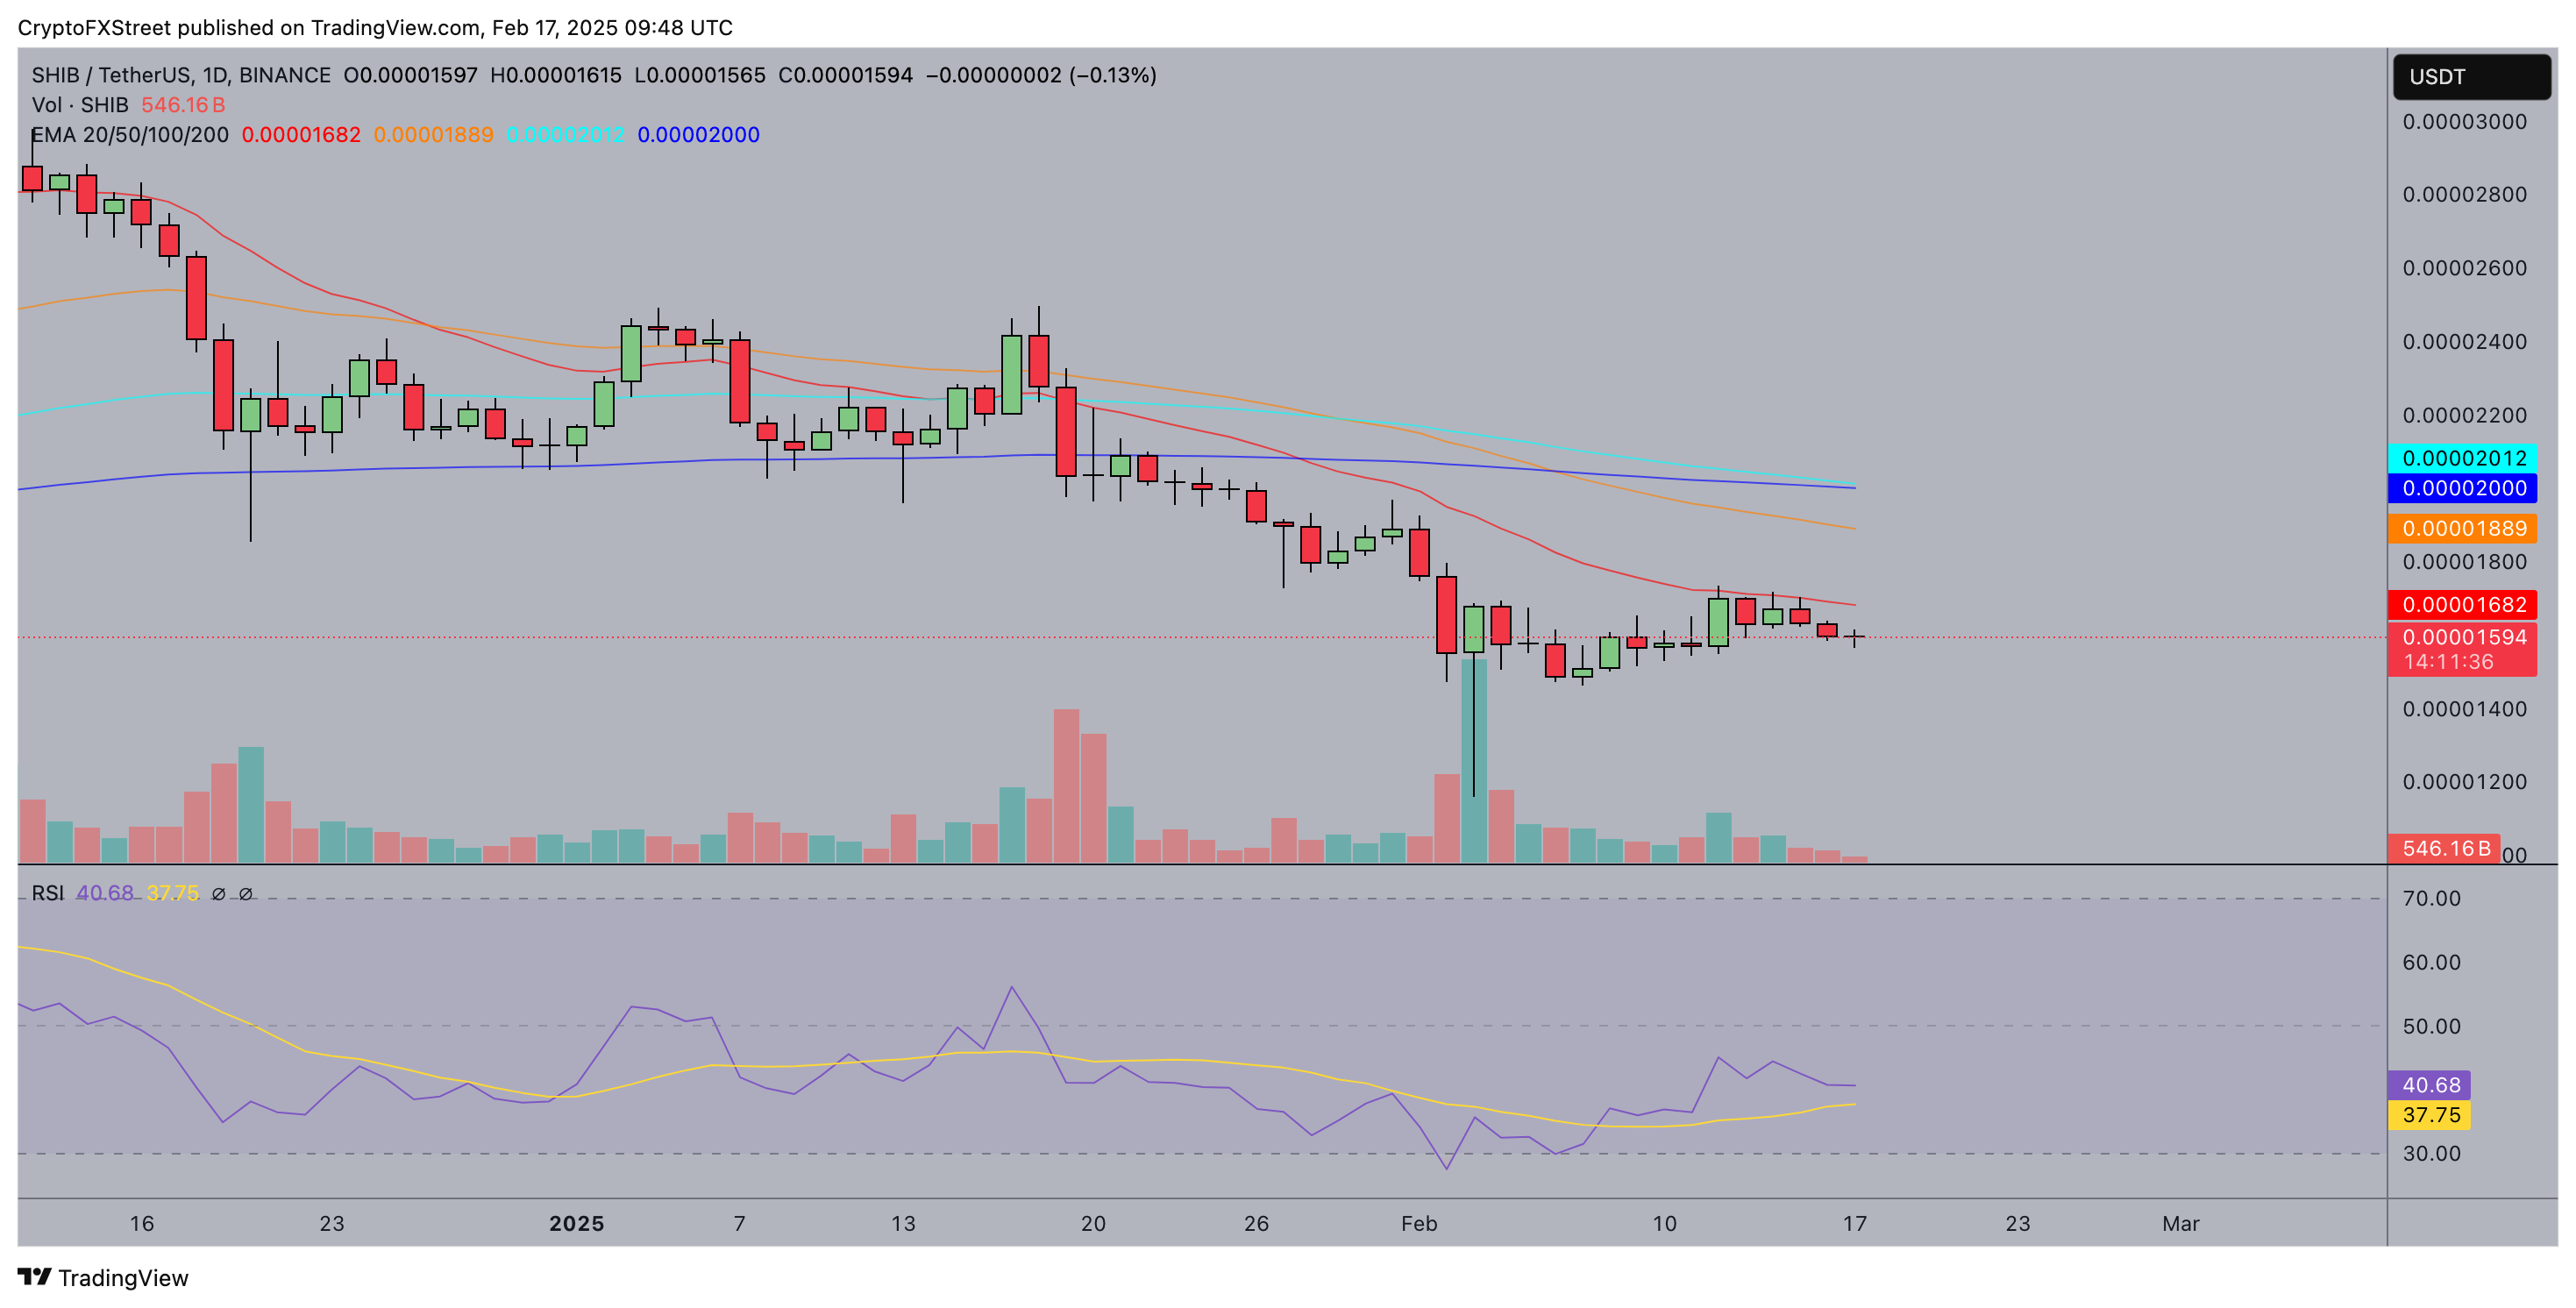
Momentum indicators in the daily chart further confirm downside risks.
The Forecast Oscillator stands at -4.56, reflecting weakening bullish momentum.
Meanwhile, the MACD line at -1.71 remains below the signal line (-6.69), with deepening red histogram bars signaling sustained bearish momentum.
If sellers maintain control, SOL could breach its immediate support at $180, paving the way for a slide toward $175.
However, an overextension of bearish bets could set the stage for a short squeeze. If bulls capitalize on excessive short positioning, a reversal above $190 could ignite a rebound toward $208, reclaiming lost ground.
Author

Ibrahim Ajibade
FXStreet
Ibrahim Ajibade is an accomplished Crypto markets Reporter who began his career in commercial banking. He holds a BSc, Economics, from University of Ibadan.


