Shiba Inu price shows serious bullish strength as bulls finds support on the daily trend
- Shiba Inu price is consolidating at the median line within a parallel channel.
- SHIB price is in buy territory on the Relative Strength Index.
- Invalidation of the current uptrend will be a close below $0.00002370/

Shiba Inu price could continue the bull run as the bulls add more reasons to hodl as the week comes to a close.
Shiba Inu price has multiple bullish signals
Shiba Inu price has been another enjoyable cryptocurrency amongst traders as the SHIB price action has been in sync with classical chart pattern trading methods. It was mentioned in last week's thesis that Shiba Inu bulls would likely rally 15% to $0.00002861. Just days ago, the bulls successfully validated the bullish trade setup as the Shiba Inu price soared into the target level, making a new swing high at $0.00002957.
Shiba Inu price managed to break the 100 Day moving average during the rally before falling below it during yesterday's sell-off. It is worth noting that choppy back and forth price action is common around prominent moving averages. Therefore, the bulls could still maintain their strength.
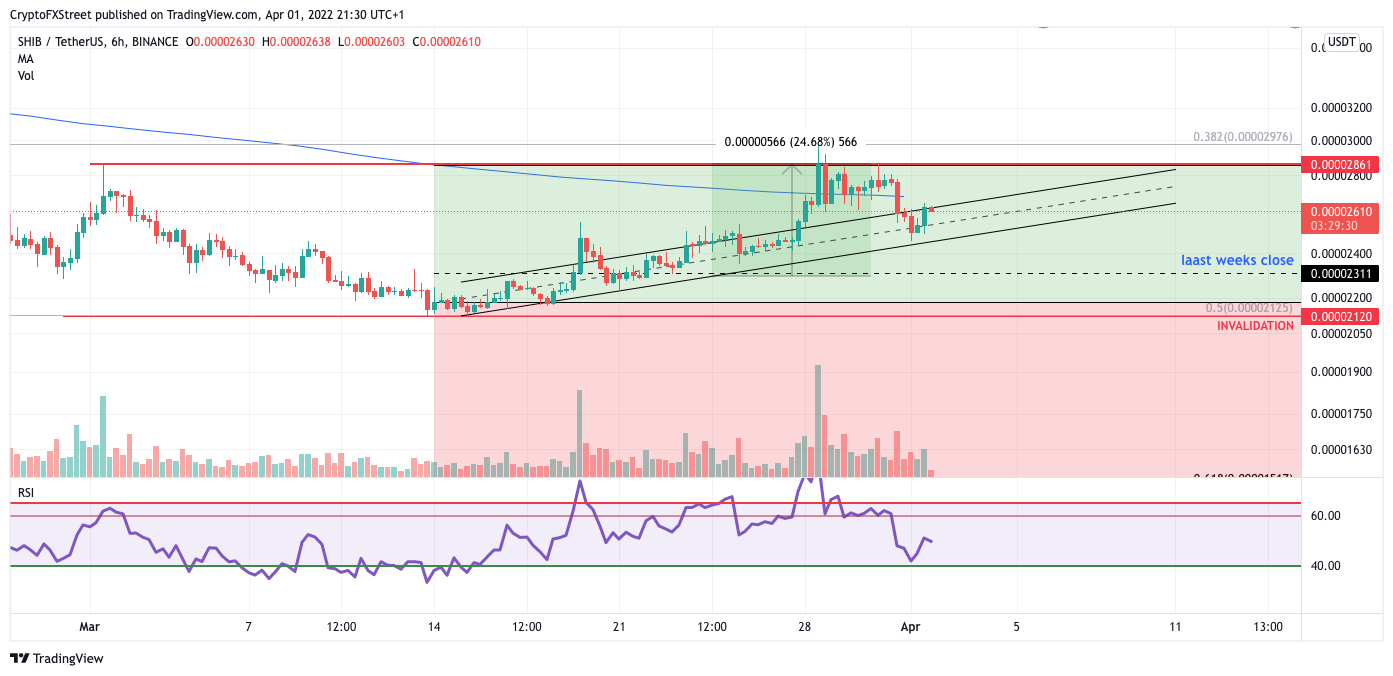
SHIB/USD 6-Hour Chart
SHIB price provides bullish confluence on the 6-hour chart. For one, the daily trend channel was successfully breached during the 15% rally. Secondly, the current price of $0.0002630 is above the median line of the parallel channel. Lastly, The Relative strength index shows a bottom at 40. With these bullish signals, bears looking to short the notorious meme coin should be careful.
An invalidation for the bullish setup will be a breach below the parallel trend channel at $.00002280. Should this occur, then the overall trend would be deemed a failure. The bulls would likely send Shiba Inu price into $0.00002000 and $0.00001950, resulting in up to a 25% correction from the current SHIB price.
Author

FXStreet Team
FXStreet
Composed of a group of economic journalists and FX experts, the FXStreet content team produces and oversees all content published on FXStreet. It provides a purely journalistic approach to the Forex market.



