Shiba Inu price poised for 18% rally after three-month-long downtrend
- Shiba Inu price finds support around $0.00001694 the 200-week Exponential Moving Average.
- On-chain data shows SHIB’s capitulation event occurred on June 24 and is poised for a rally.
- A weekly candlestick close below $0.00001690 would invalidate the bullish thesis.
Shiba Inu (SHIB) price found support at the 200-week Exponential Moving Average and is currently trading up 2.3% on Wednesday. On-chain data indicates SHIB experienced a capitulation event on June 24, with supply on exchanges decreasing, suggesting bullish momentum could drive SHIB's price higher in the coming days.
Shiba Inu price shows promise
Shiba Inu price found support at the 200-week Exponential Moving Average (EMA) around the $0.00001694 level and is currently trading at $0.00001757, 2.3% above it on Wednesday.
The 200-week Exponential Moving Average roughly coincides with the weekly support level of $0.00001690, considered a key support level.
If this support level holds, SHIB could rally 18% to retest its resistance level at $0.0000208, the 61.8% Fibonacci retracement level drawn from the weekly swing low of $0.0000054 from June 5, 2023, to the weekly swing high of $0.00004575 from March 4, 2024.
The Relative Strength Index (RSI) on the weekly chart has briefly slipped below the 50 mean level, while the Awesome Oscillator (AO) is on its way to doing the same. If bulls are indeed making a comeback, then both momentum indicators must maintain their positions above their respective mean levels. Such a development would add a tailwind to the recovery rally.
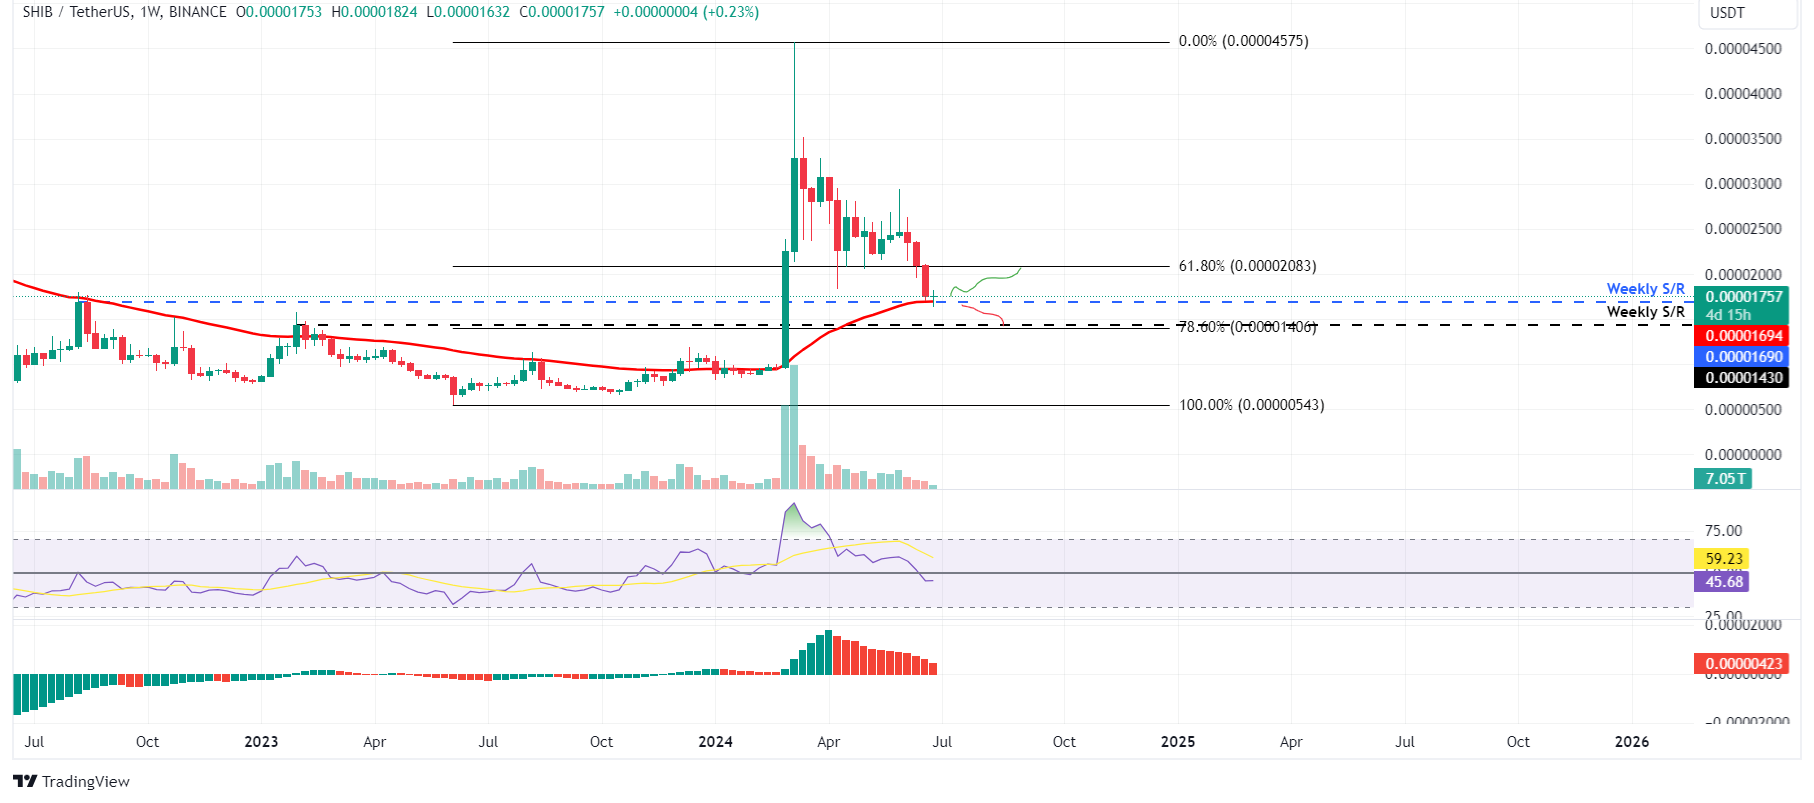
SHIB/USDT weekly chart
Based on IntoTheBlock's Global In/Out of the Money (GIOM), nearly 60,110 addresses accumulated 58.85 trillion SHIB tokens at an average price of $0.000016.These addresses bought the dog-based meme token between $0.000014 and $0.000017, which makes it a key support zone. These investors will likely add more to their holdings if the price retraces.
Interestingly, the $0.000014 to $0.000017 zone mentioned from a technical analysis perspective coincides with the GIOM findings, making this zone a key reversal zone to watch.
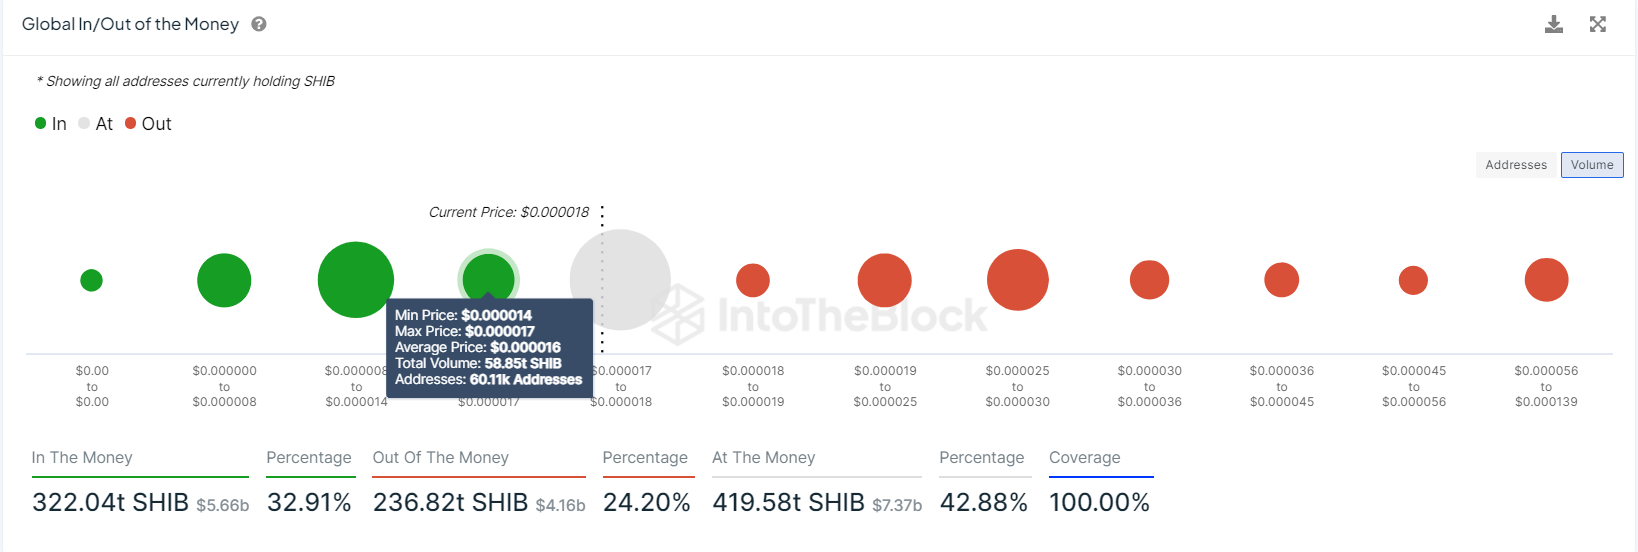
SHIB GIOM chart
On-chain data provider Santiment’s Network Realized Profit/Loss (NPL) indicator computes a daily network-level Return On Investment (ROI) based on the coin’s on-chain transaction volume. Simply put, it is used to measure market pain. Strong spikes in a coin’s NPL indicate that its holders are, on average, selling their bags at a significant profit. On the other hand, strong dips imply that the coin’s holders are, on average, realizing losses, suggesting panic sell-offs and investor capitulation.
In SHIB’s case, the NPL indicator dipped to -1.85 million and -15.08 million on June 23 and 24, coinciding with a 5.28% price decline. This negative downtick indicates that the holders were, on average, realizing losses.
During this capitulation event, the SHIB’s supply on exchanges declined from 73.15 million to 72.5 million in two days. This decrease in supply on exchanges indicates that investors are moving SHIB tokens to wallets and reducing selling activity, signaling a bullish outlook and further denoting investor confidence in Shiba Inu.
%20[15.32.50,%2026%20Jun,%202024]-638550061936295438.png)
SHIB Network Realized Profit/Loss and Supply on Exchanges chart
Even though the on-chain metric and technical analysis point to a bullish outlook, if SHIB’s weekly candlestick closes below $0.00001690, the weekly support level, this move would invalidate the bullish thesis by producing a lower low on a weekly timeframe. This development could see Shiba Inu’s price fall 16% to the next weekly support level of $0.00001430.
Author

Manish Chhetri
FXStreet
Manish Chhetri is a crypto specialist with over four years of experience in the cryptocurrency industry.


