Shiba Inu price is on the cusp of a 39% explosion
- Shiba Inu price could flare up to $0.00001679 if the 200-day SMA hurdle crumbles.
- A stubborn inverse head-and-shoulders neckline resistance may be the only bump between SHIB and a 39% move.
- The IOMAP metric reinforces the upside target at $0.00001700, where some investors could empty their bags.
Shiba Inu price is on the frontline of ushering in the weekend with a daily bullish candle alongside other crypto assets such as Solana, Binance Coin and Polkadot. SHIB’s trading over the last few days has been somewhat sideways. Conversely, a bullish breakout may be in the offing, especially if the token makes a daily close above $0.00001220.
Shiba Inu price’s 39% move depends on the inverse head-and-shoulders pattern
Shiba Inu price formed an inverse head-and-shoulders (H&) pattern between May and August, as seen in the chart below. Crucial support at $0.00000740 allowed buyers to regain control against the backdrop of dire losses in May. This buyer congestion zone positively influenced SHIB but only up to $0.00001220.
Since the H&S pattern is highly bullish, Shiba Inu price has a good chance of sprinting to $0.00001679 – if it can make a clean break above the neckline. For now, buyers must subdue the overhead selling pressure brought to light by the 200-day Simple Moving Average (SMA) on the 12-hour chart.
The Moving Average Convergence Divergence (MACD) in the same timeframe would be required to hold above the mean line as well as keep the buy signal intact, affirming a solid bullish grip.
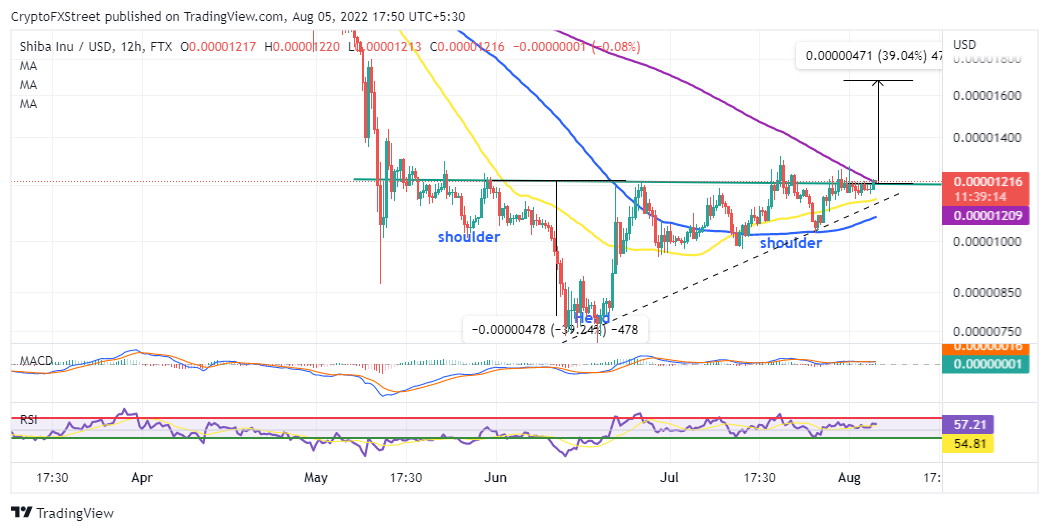
SHIB/USD 12-hour chart
On the flip side, the 50-day SMA provides immediate support slightly above an ascending trendline. Therefore, in the event of a bearish reversal, Shiba Inu price may recoil at a higher low, as long as the trend line is not broken.
From a fundamental perspective, Shiba Inu may exhaust the uptrend in the region between $0.00001400 and $0.00002100. IntoTheBlock’s IOMAP on-chain metric reveals that around 101,000 addresses previously purchased approximately 445.9 trillion SHIB tokens in the range.
-637953051762830340.png)
Shiba Inu IOMAP chart
Traders preparing to make the most out of Shiba Inu price breakout to $0.00001679 should consider taking profit at $0.00001400, with the bullish holding out till $0.00001700. These targets factor in overhead pressure as investors sell at their respective breakeven price points.
Author

John Isige
FXStreet
John Isige is a seasoned cryptocurrency journalist and markets analyst committed to delivering high-quality, actionable insights tailored to traders, investors, and crypto enthusiasts. He enjoys deep dives into emerging Web3 tren


