Shiba Inu Price Forecast: Correction looms amid whale sell-off and falling supply in profit
- Shiba Inu's supply in profit drops significantly as whales offload SHIB amid low performance.
- Optimism wanes in Shiba Inu derivatives as Open Interest and the Long/Short ratio decline.
- The technical outlook shares a bearish bias as Shiba Inu reverses from the 50-day EMA.

Shiba Inu (SHIB) trades in the red on Thursday, extending the 3.22% drop from the previous day. Facing headwinds at the 50-day EMA, Shiba Inu risks a steeper correction as the large investors trim their SHIB holdings, concurrent with the supply in profit dropping to 23%.
Whales’ confidence drops in Shiba Inu
Santiment data shows groups of large investors pruning their portfolios to offload Shiba Inu. The group of whales holding 10 million to 100 million SHIB tokens currently holds 9.34 trillion SHIB, representing a decline of 9 billion tokens from 9.43 trillion SHIB on January 1.
Investors with 100 million to 1 billion SHIB holding 17.95 trillion tokens trimmed 720 billion tokens compared to 18.67 trillion tokens at the start of 2025. The decline in whale holdings suggests a drop in confidence, potentially hampering long-term growth.
Amid the sell-off, the lackluster performance of Shiba Inu has dropped its supply in profit to 23%, compared to the 75% on January 1, suggesting that the majority of its investors are under pressure.
 [14-1749723266252.16.58, 12 Jun, 2025].png)
Shiba Inu supply distribution. Source: Santiment
Shiba Inu long liquidation spike fades optimism
CoinGlass data indicates a near 3% drop in Shiba Inu Open Interest (OI) to $172 million. The declining OI represents an outflow from SHIB derivatives, either due to a liquidation spike or the booking of profits or losses.
The 24-hour liquidations show the case of an enormous wipe-out of bullish positions, rising to $331K, while short liquidations amount to $15K. With the imbalance in derivative positions taking a bearish tilt, the long/short ratio at 0.8871 signals an increase in bearish positions.
Despite fading optimism, the OI-weighted funding rate remains at 0.0084%, indicating heightened activity among non-liquidated bulls willing to pay rates to align derivatives and spot market prices.
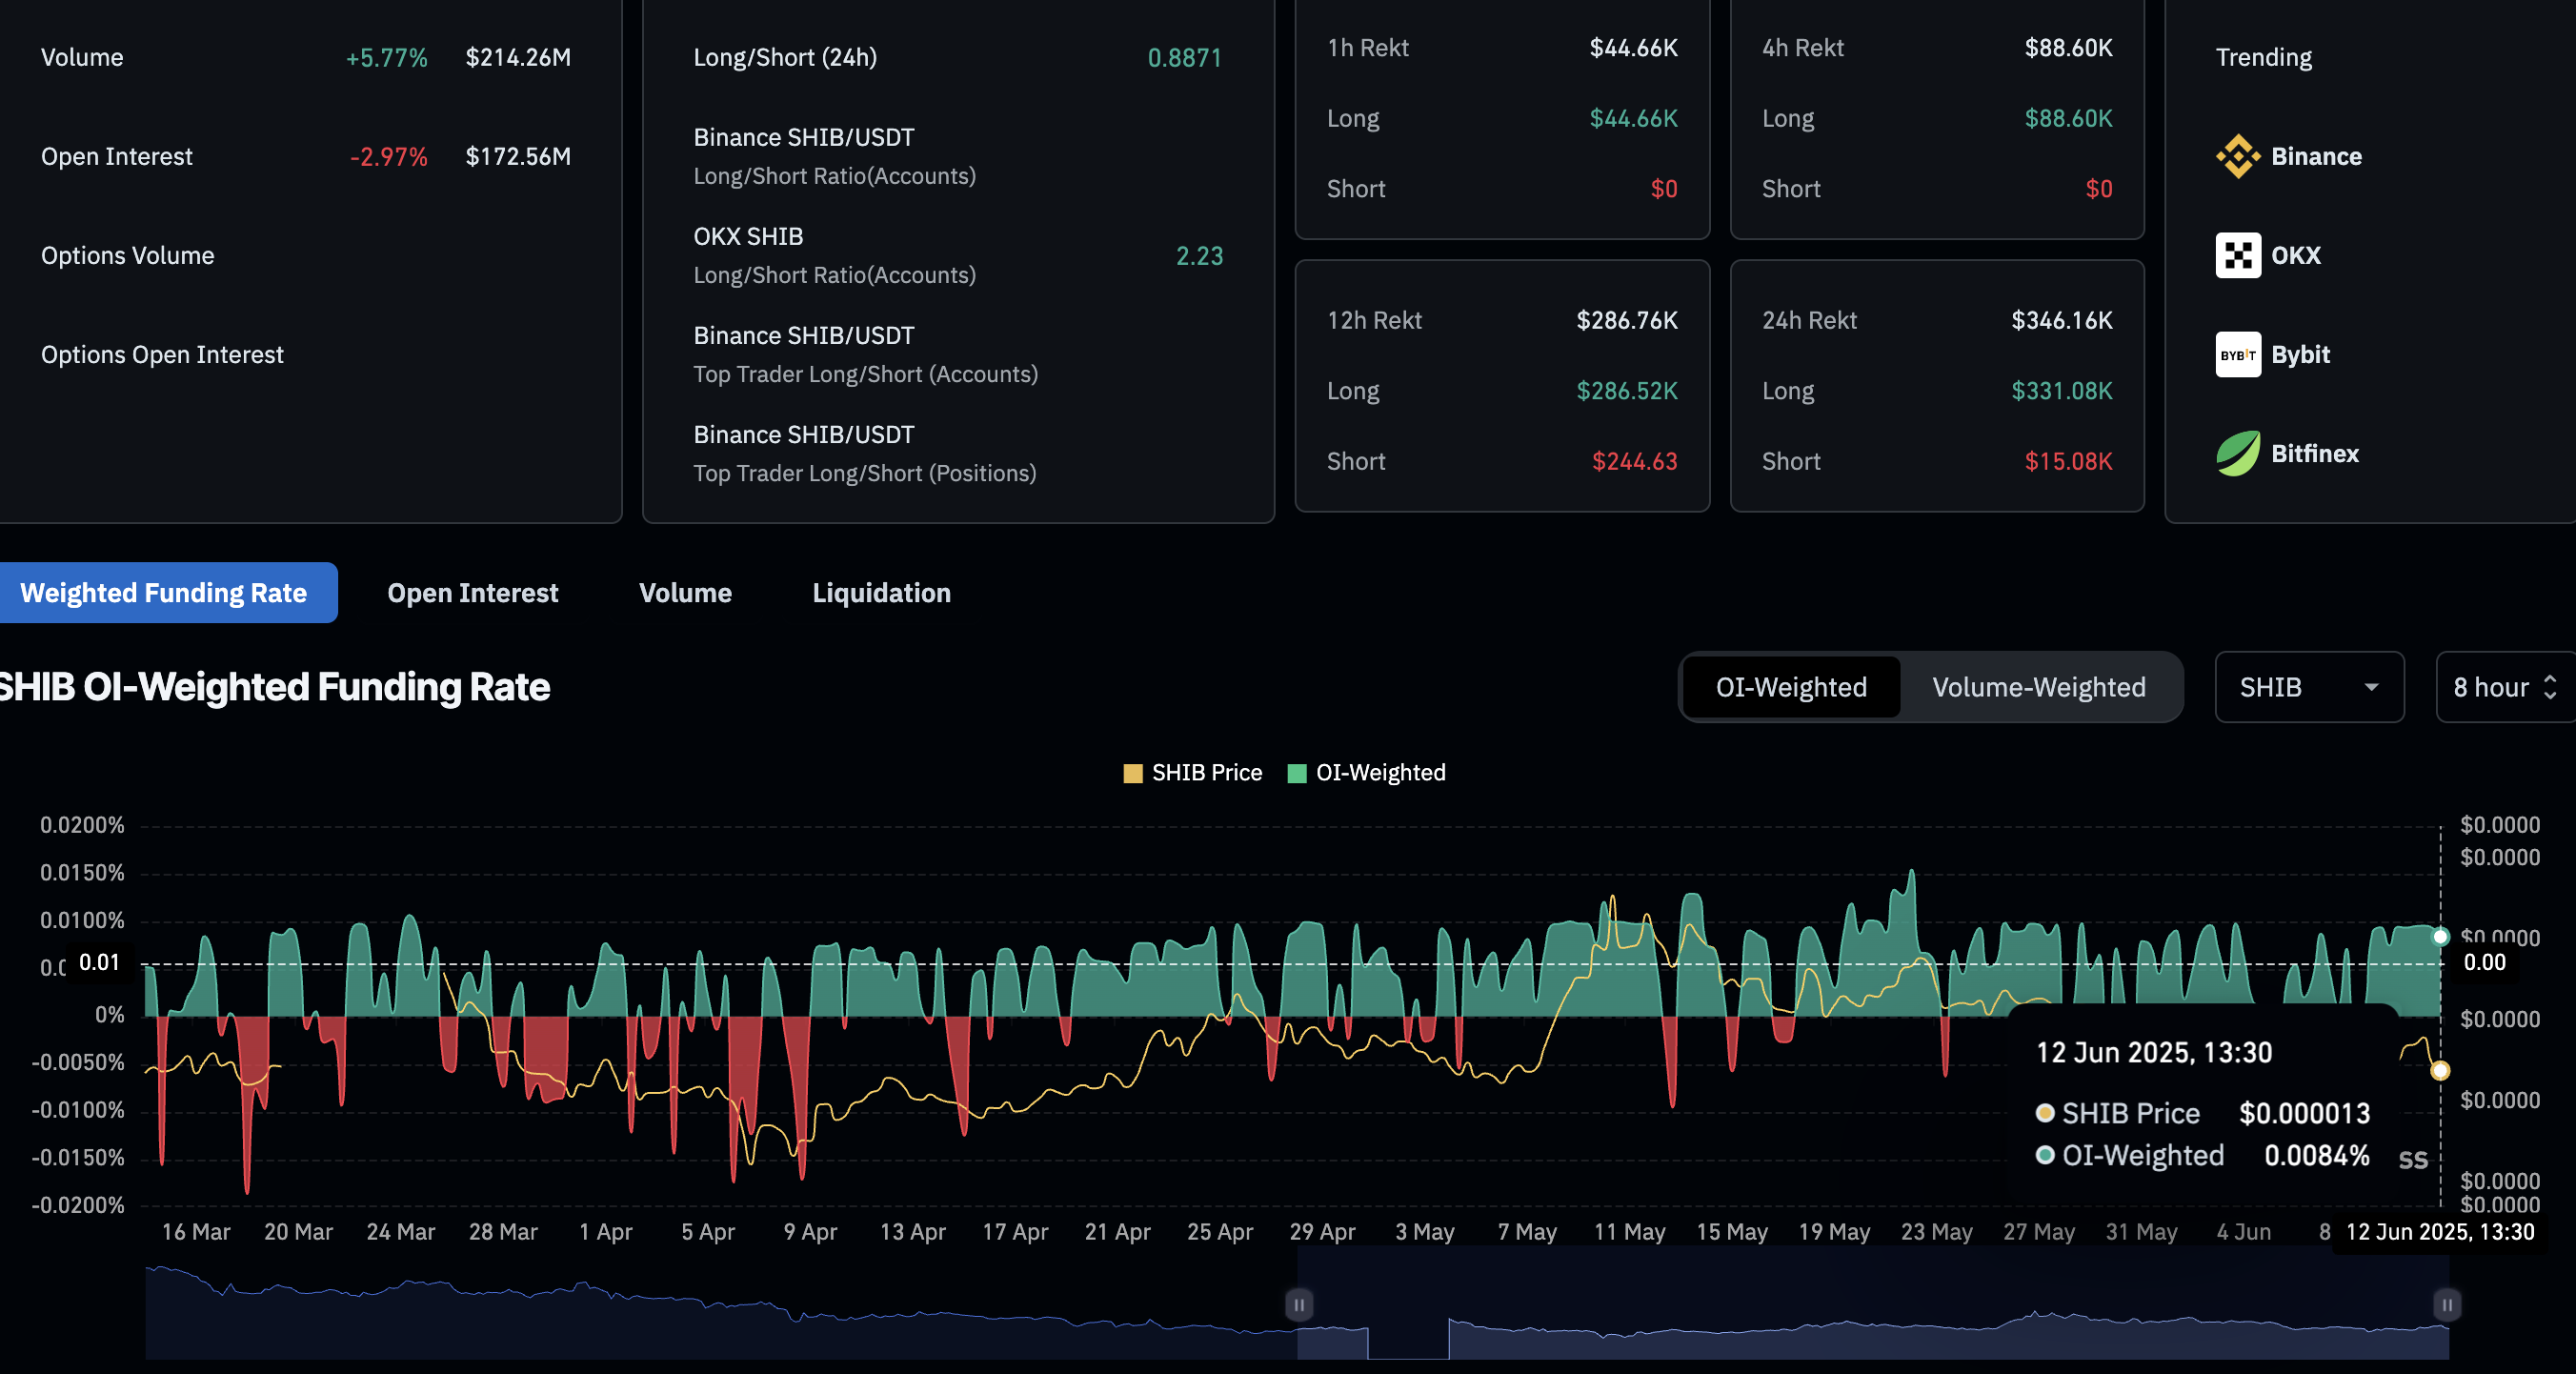
Shiba Inu derivatives data. Source: Coinglass
Shiba Inu downfall target $0.00001029
Shiba Inu prolongs the lower highs formation with a recent bearish reversal from the 50-day Exponential Moving Average (EMA). Following a 3.22% drop on Wednesday, SHIB edges lower by 2.40% at press time.
If SHIB continues to decline, it could test the $0.00001200 support level, last tested on June 5. Short position holders could ride the declining trend with a trailing stop loss towards the next support at the $0.00001150 level, last tested in March, and the year-to-date low at $0.00001029.
The Moving Average Convergence/Divergence (MACD) indicator moves flat with its converged signal line indicating uncertainty in the short term due to a delay in bullish crossover. A downside move in SHIB could prolong the bearish trend in the MACD and signal line.
The Relative Strength Index (RSI) fails to cross above the halfway line and drops to 43, indicating a failed resurgence in bullish momentum. With space left on the downside before reaching the oversold zone, the indicator warns of significant room for correction.
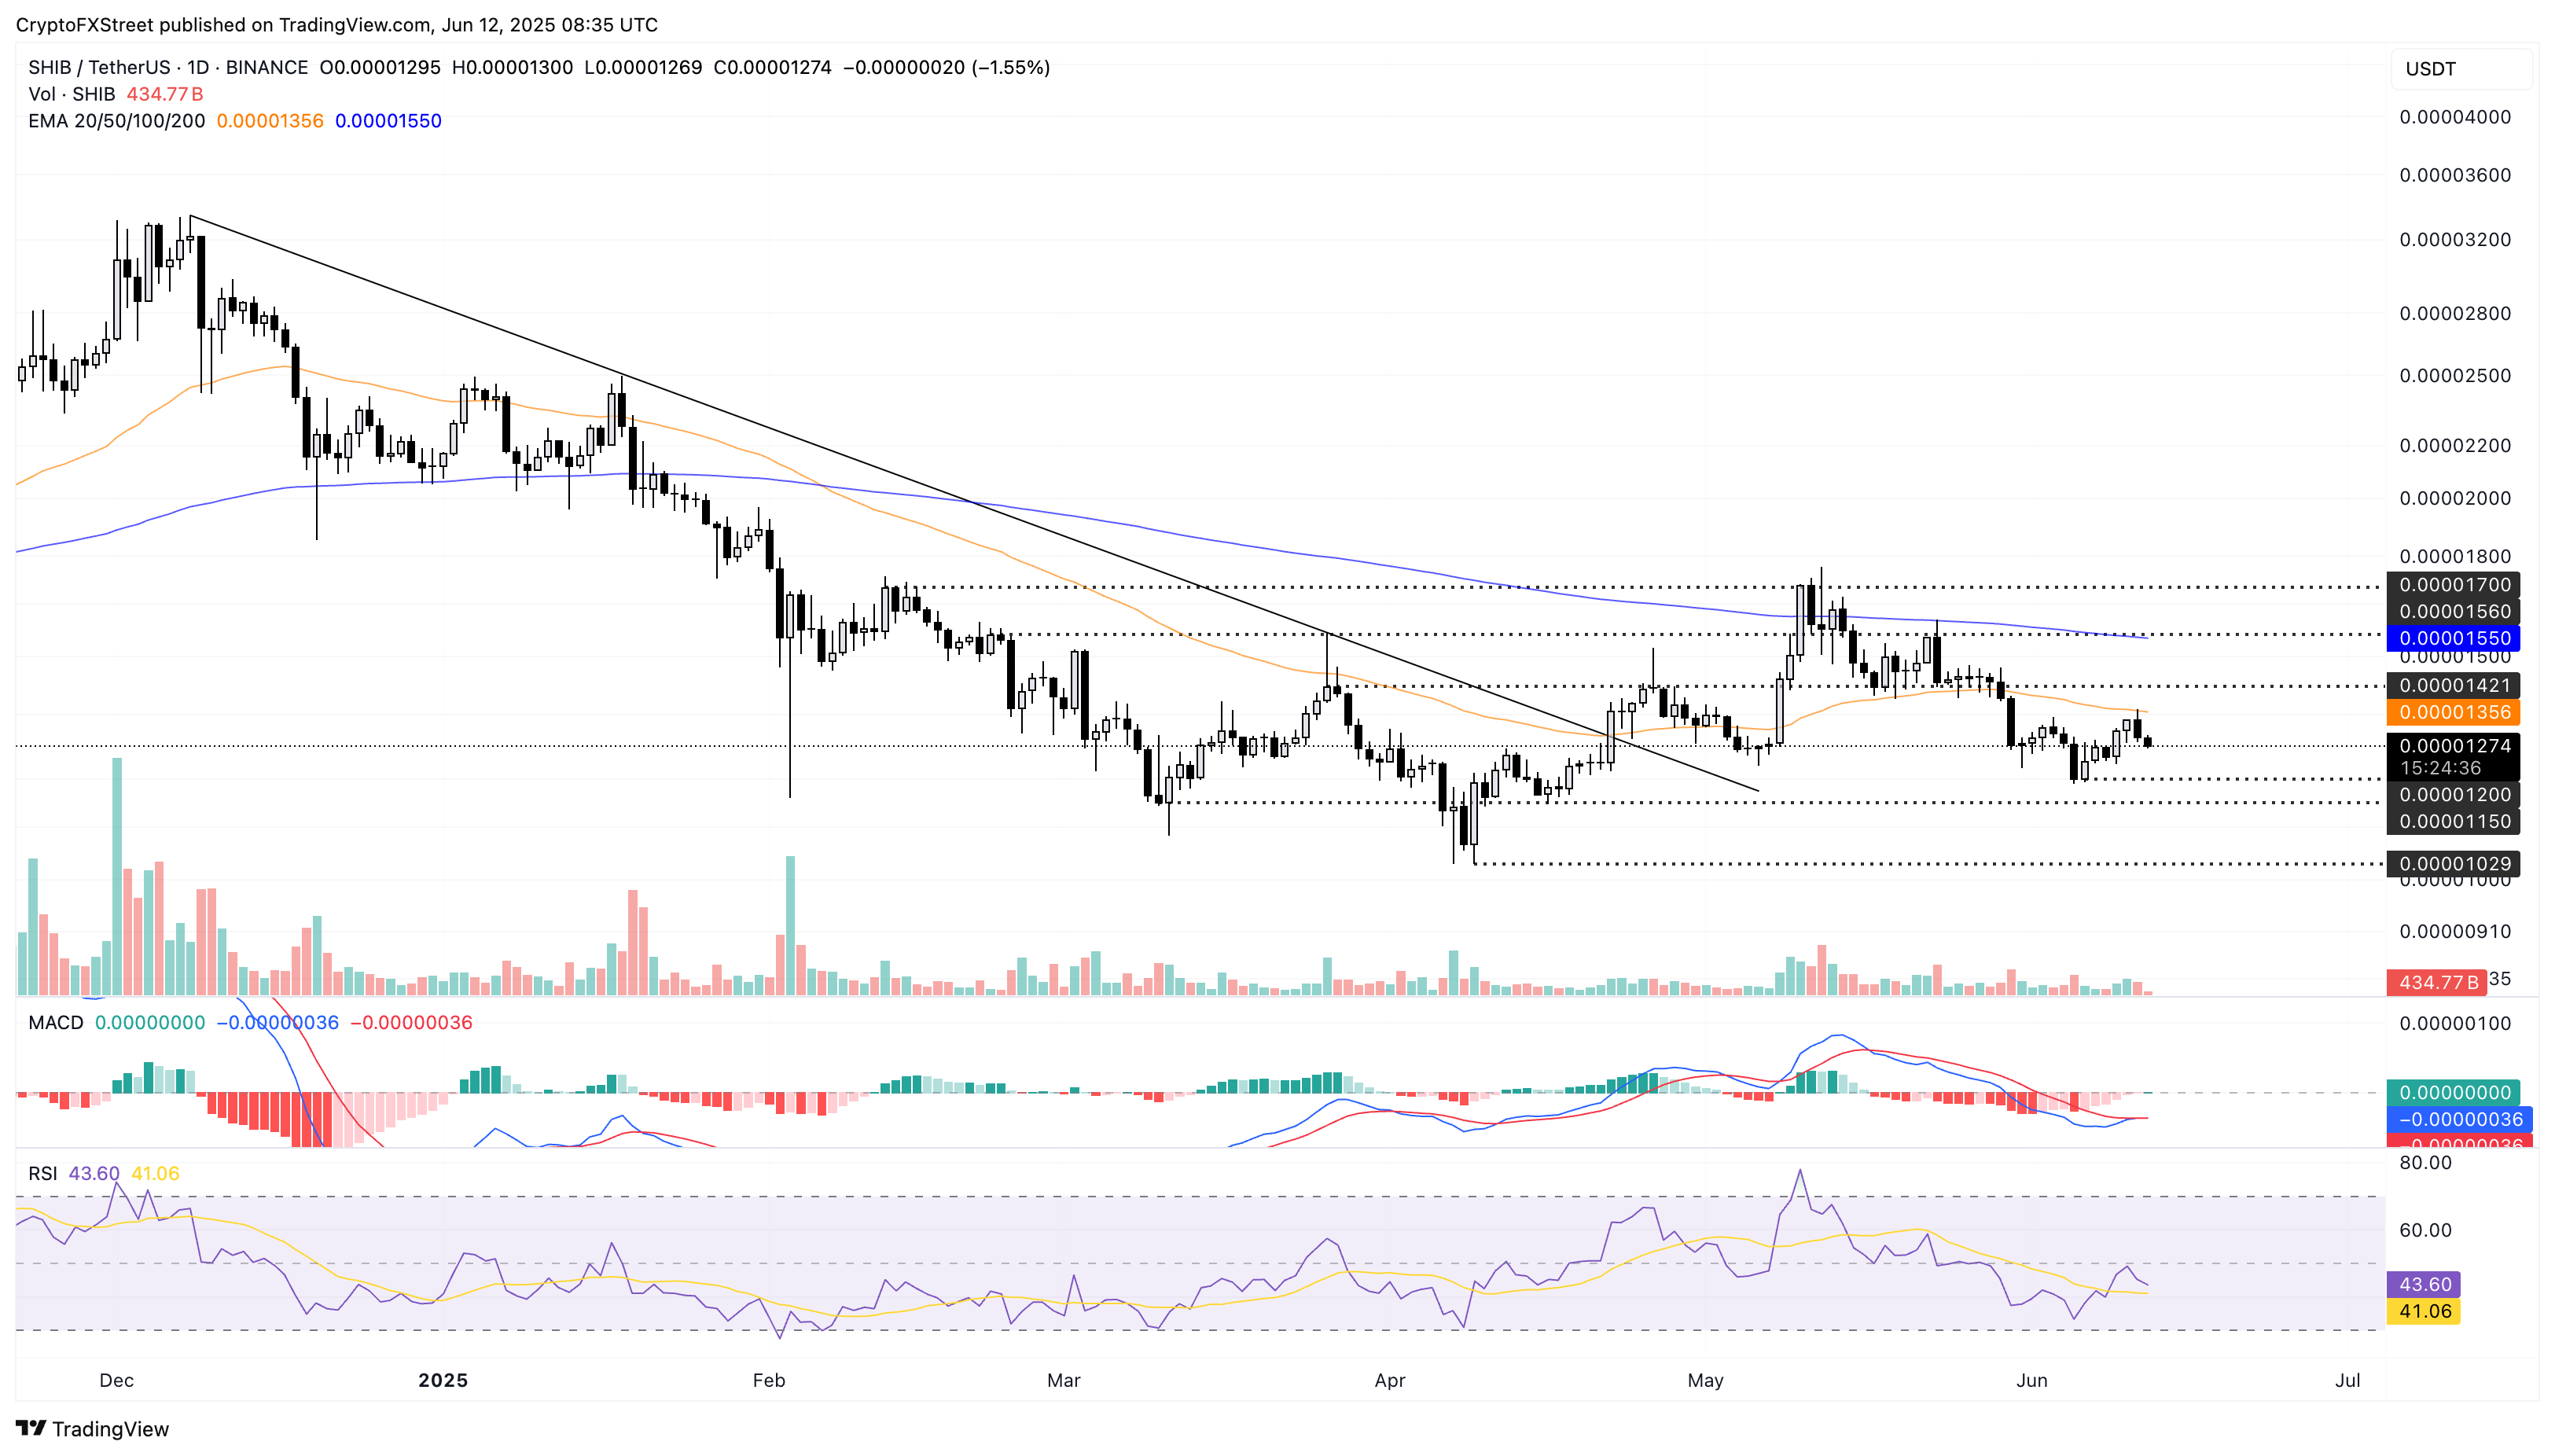
SHIB/USDT daily price chart.
If Shiba Inu bounces off with a broader market recovery, a closing above $0.00001421, marked by the March 26 peak, investors could witness a bullish turnaround. In such a case, the resistance levels are at $0.00001550 and $0.00001700, marked by peaks on February 22 and February 12, respectively.
Author

Vishal Dixit
FXStreet
Vishal Dixit holds a B.Sc. in Chemistry from Wilson College but found his true calling in the world of crypto.