Shiba Inu price faces tough challenges ahead before SHIB returns to $0.00004327
- Shiba Inu could be gearing up for a 46% surge if the bulls manage to lift prices above $0.00003009.
- However, SHIB may face multiple obstacles ahead before the optimistic target could be reached.
- The bullish outlook would be invalidated if Shiba Inu slides below $0.00002434.
Shiba Inu price is struggling to break out of the prevailing chart pattern formation as it continues to record lower highs. However, the governing technical pattern projects a 46% ascent toward $0.00004327 if SHIB slices above $0.00003009.
Shiba Inu price awaits 46% climb
Shiba Inu price has been sealed within a falling wedge pattern on the daily chart as SHIB continues to consolidate. The prevailing chart pattern suggests a bullish outlook for the canine-themed token if it manages to slice above the upper boundary coinciding with the 21-day Simple Moving Average (SMA) at $0.00003009.
If Shiba Inu price breaks above the aforementioned level of resistance, SHIB may face a hurdle at the 23.6% Fibonacci retracement level at $0.00003218, before another obstacle emerges at the 50-day SMA at $0.00003358, intersecting with the resistance line given by the Momentum Reversal Indicator (MRI).
Additional headwind may appear at the 38.2% Fibonacci retracement level at $0.00003642 before SHIB reaches a stiff hurdle at the 50% retracement level at $0.00003984 which coincides with the 100-day SMA.
Only if Shiba Inu price manages to tackle all the aforementioned obstacles would see the bulls reach the bullish target at $0.00004327, where the 61.8% Fibonacci retracement level also sits.
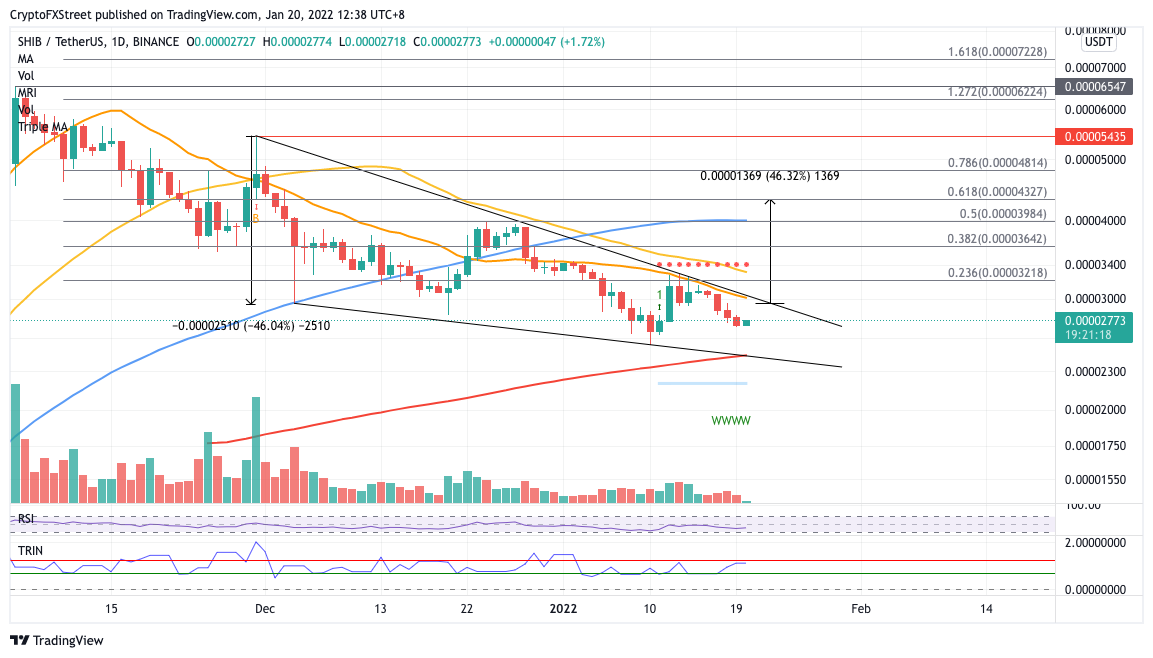
SHIB/USDT daily chart
Adding credence to the optimistic outlook is the bottom signal given by the MRI on the 12-hour chart, suggesting that the bulls are ready to reverse the period of underperformance.
However, if selling pressure increases, Shiba Inu price may fall toward the lower boundary of the prevailing chart pattern at $0.00002434, which coincides with the 200-day SMA. This level should act as reliable support for SHIB but investors should note that further decline may mean that the bullish outlook will be voided.
Author

Sarah Tran
Independent Analyst
Sarah has closely followed the growth of blockchain technology and its adoption since 2016.


