- SHIB price breaches 200-SMA on the 4H chart, calls for more downside.
- A test of the horizontal trendline support at $0.00000463 remains on the cards.
- Bear cross keeps the sellers hopeful while RSI remains bearish.
The Shib price is looking to extend Friday’s sell-off, as China’s regulatory implications continue to haunt the cryptocurrency market, keeping the buyers on the sidelines.
The canine-themed coin is shedding nearly 11% so far this Saturday, having lost about 70% of its value from record highs of $0.000039.
SHIB price braces for more declines
The Shib price is consolidating the latest leg down to $0.0000065 lows, as the bears gather strength for the next push lower.
At the time of writing, Shiba Inu is trading around $0.0000070, having breached the last line of defense for the bulls, which is the critical 200-simple moving average (SMA) on the four-hour chart. That level is now seen at $0.0000084.
The Relative Strength Index (RSI) is seeing an upturn but remains way below the central line, suggesting that any pullbacks are likely to remain short-lived.
Meanwhile, an impending bear cross on the said time frame, with the 21-SMA approaching the 200-SMA, also boosts the odds for a fresh downswing.
It’s worth mentioning that the Shib price met fresh supply and breached the 200-SMA on a sustained basis after the 50-SMA pierced the 100-SMA from above and confirmed a bear cross during Friday’s European hours.
This implies that if the 21 and 200—SMAs bearish crossover materializes, any chance of a bullish reversal could get invalidated, exposing the $0.00000654 low, reached due to Wednesday’s market collapse.
A firm break below the latter could trigger a steep drop towards the key horizontal support at $0.00000463.
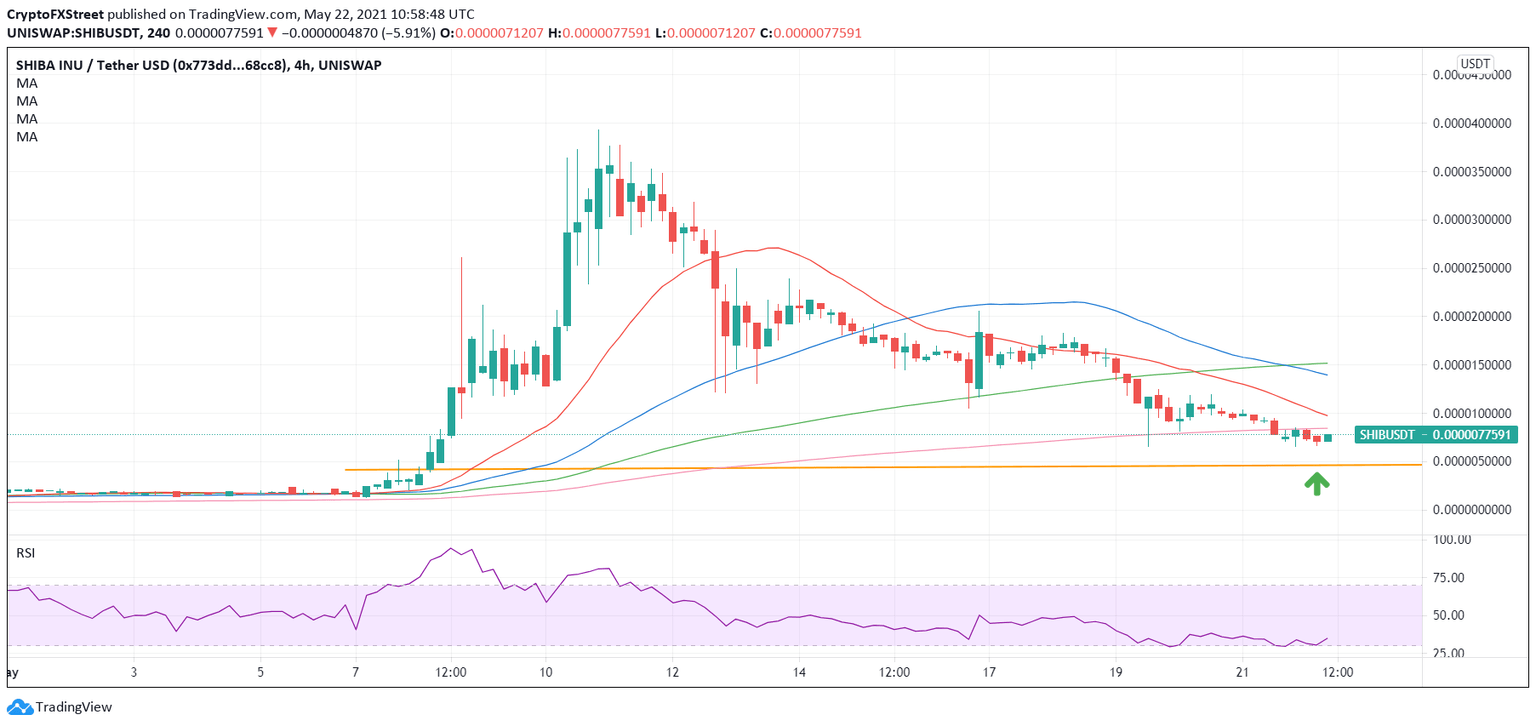
SHIB/USDT: Four-hour chart
Alternatively, the Shib buyers need acceptance above the 200-SMA support now resistance for any recovery attempts.
Further up, the bearish 21-SMA cap of $0.00000972 could be challenged.
All in all, the path of least resistance for the Shib price appears to the downside.
Information on these pages contains forward-looking statements that involve risks and uncertainties. Markets and instruments profiled on this page are for informational purposes only and should not in any way come across as a recommendation to buy or sell in these assets. You should do your own thorough research before making any investment decisions. FXStreet does not in any way guarantee that this information is free from mistakes, errors, or material misstatements. It also does not guarantee that this information is of a timely nature. Investing in Open Markets involves a great deal of risk, including the loss of all or a portion of your investment, as well as emotional distress. All risks, losses and costs associated with investing, including total loss of principal, are your responsibility. The views and opinions expressed in this article are those of the authors and do not necessarily reflect the official policy or position of FXStreet nor its advertisers. The author will not be held responsible for information that is found at the end of links posted on this page.
If not otherwise explicitly mentioned in the body of the article, at the time of writing, the author has no position in any stock mentioned in this article and no business relationship with any company mentioned. The author has not received compensation for writing this article, other than from FXStreet.
FXStreet and the author do not provide personalized recommendations. The author makes no representations as to the accuracy, completeness, or suitability of this information. FXStreet and the author will not be liable for any errors, omissions or any losses, injuries or damages arising from this information and its display or use. Errors and omissions excepted.
The author and FXStreet are not registered investment advisors and nothing in this article is intended to be investment advice.
Recommended Content
Editors’ Picks
Why Polygon’s MATIC may have seen a bottom amid underperformance
Polygon MATIC, now known as POL, has been one of the most underperforming cryptocurrencies in the top 100 since the beginning of the year, declining more than 62% year-to-date. However, several key metrics on Wednesday show that its price may have seen a bottom.
SUI rallies as Circle announces the launch of USDC on its network
Layer-1 blockchain Sui has been gaining constant attention following big launches on its network, including the latest launch from USDC issuer Circle. Circle announced its plans to launch its USDC stablecoin on the Sui blockchain on Tuesday. The announcement also included the integration of Circle's CCTP for cross-chain building among developers.
Ethereum could rally 17% amid Bitwise thesis on ETH contrarian bet
Ethereum (ETH) is up 2% on Tuesday as anticipation grows for a 50-basis-point interest rate cut by the US Federal Reserve (Fed). Meanwhile, Bitwise's weekly memo noted that Ethereum still provides several opportunities and looks like a contrarian bet.
Bitcoin rallies with crypto market on steeper Fed rate cut speculation and Q4 positivity
Bitcoin (BTC) and the crypto market saw a brief rally on Tuesday following speculations that the Federal Open Market Committee (FOMC) may opt for a 50-basis-point rate cut during its meeting on Wednesday.
Bitcoin: On the road to $60,000
Bitcoin price retested and bounced off from the daily support level of $56,000 this week. US spot Bitcoin ETFs posted $140.7 million in inflows until Thursday and on-chain data supports a bullish outlook.
Moneta Markets review 2024: All you need to know
VERIFIED In this review, the FXStreet team provides an independent and thorough analysis based on direct testing and real experiences with Moneta Markets – an excellent broker for novice to intermediate forex traders who want to broaden their knowledge base.