Sandbox remains under pressure as SAND moves to the $3 price range
- Sandbox price remains in a technical correction.
- Lower prices are expected, but a slight bounce may occur in the interim.
- The weekly chart continues to point to a much deeper move south.

Sandbox price and the broader metaverse and gaming token sector remain overbought. More room south is likely, and if the broader market faces a bullish recovery, that may even accelerate the selling of SAND.
Sandbox may experience a bounce before selling resumes
Sandbox price has a combination of support on the weekly chart and the daily chart, suggesting it may have a small bounce before further selling occurs. The currently weekly candlestick has found support against the weekly Tenkan-Sen at $4.60 and the Kijun-Sen at $4.31. But the Relative Strength Index continues to drift south from primary overbought levels, and no regular or hidden bullish divergence exists in the Composite Index.
On the daily chart, there is no Ichimoku support until the Chikou Span hits the bodies of the candlesticks below it, the closest at $4.65. Below that, the 38.2% Fibonacci retracement may contribute to some solid intermediate support. The Relative Strength Index is between the oversold levels of 40 and 50 but continues to slope down. While near historical lows, the Composite Index has a strong hook south, warning that selling pressure may not have eased up yet.
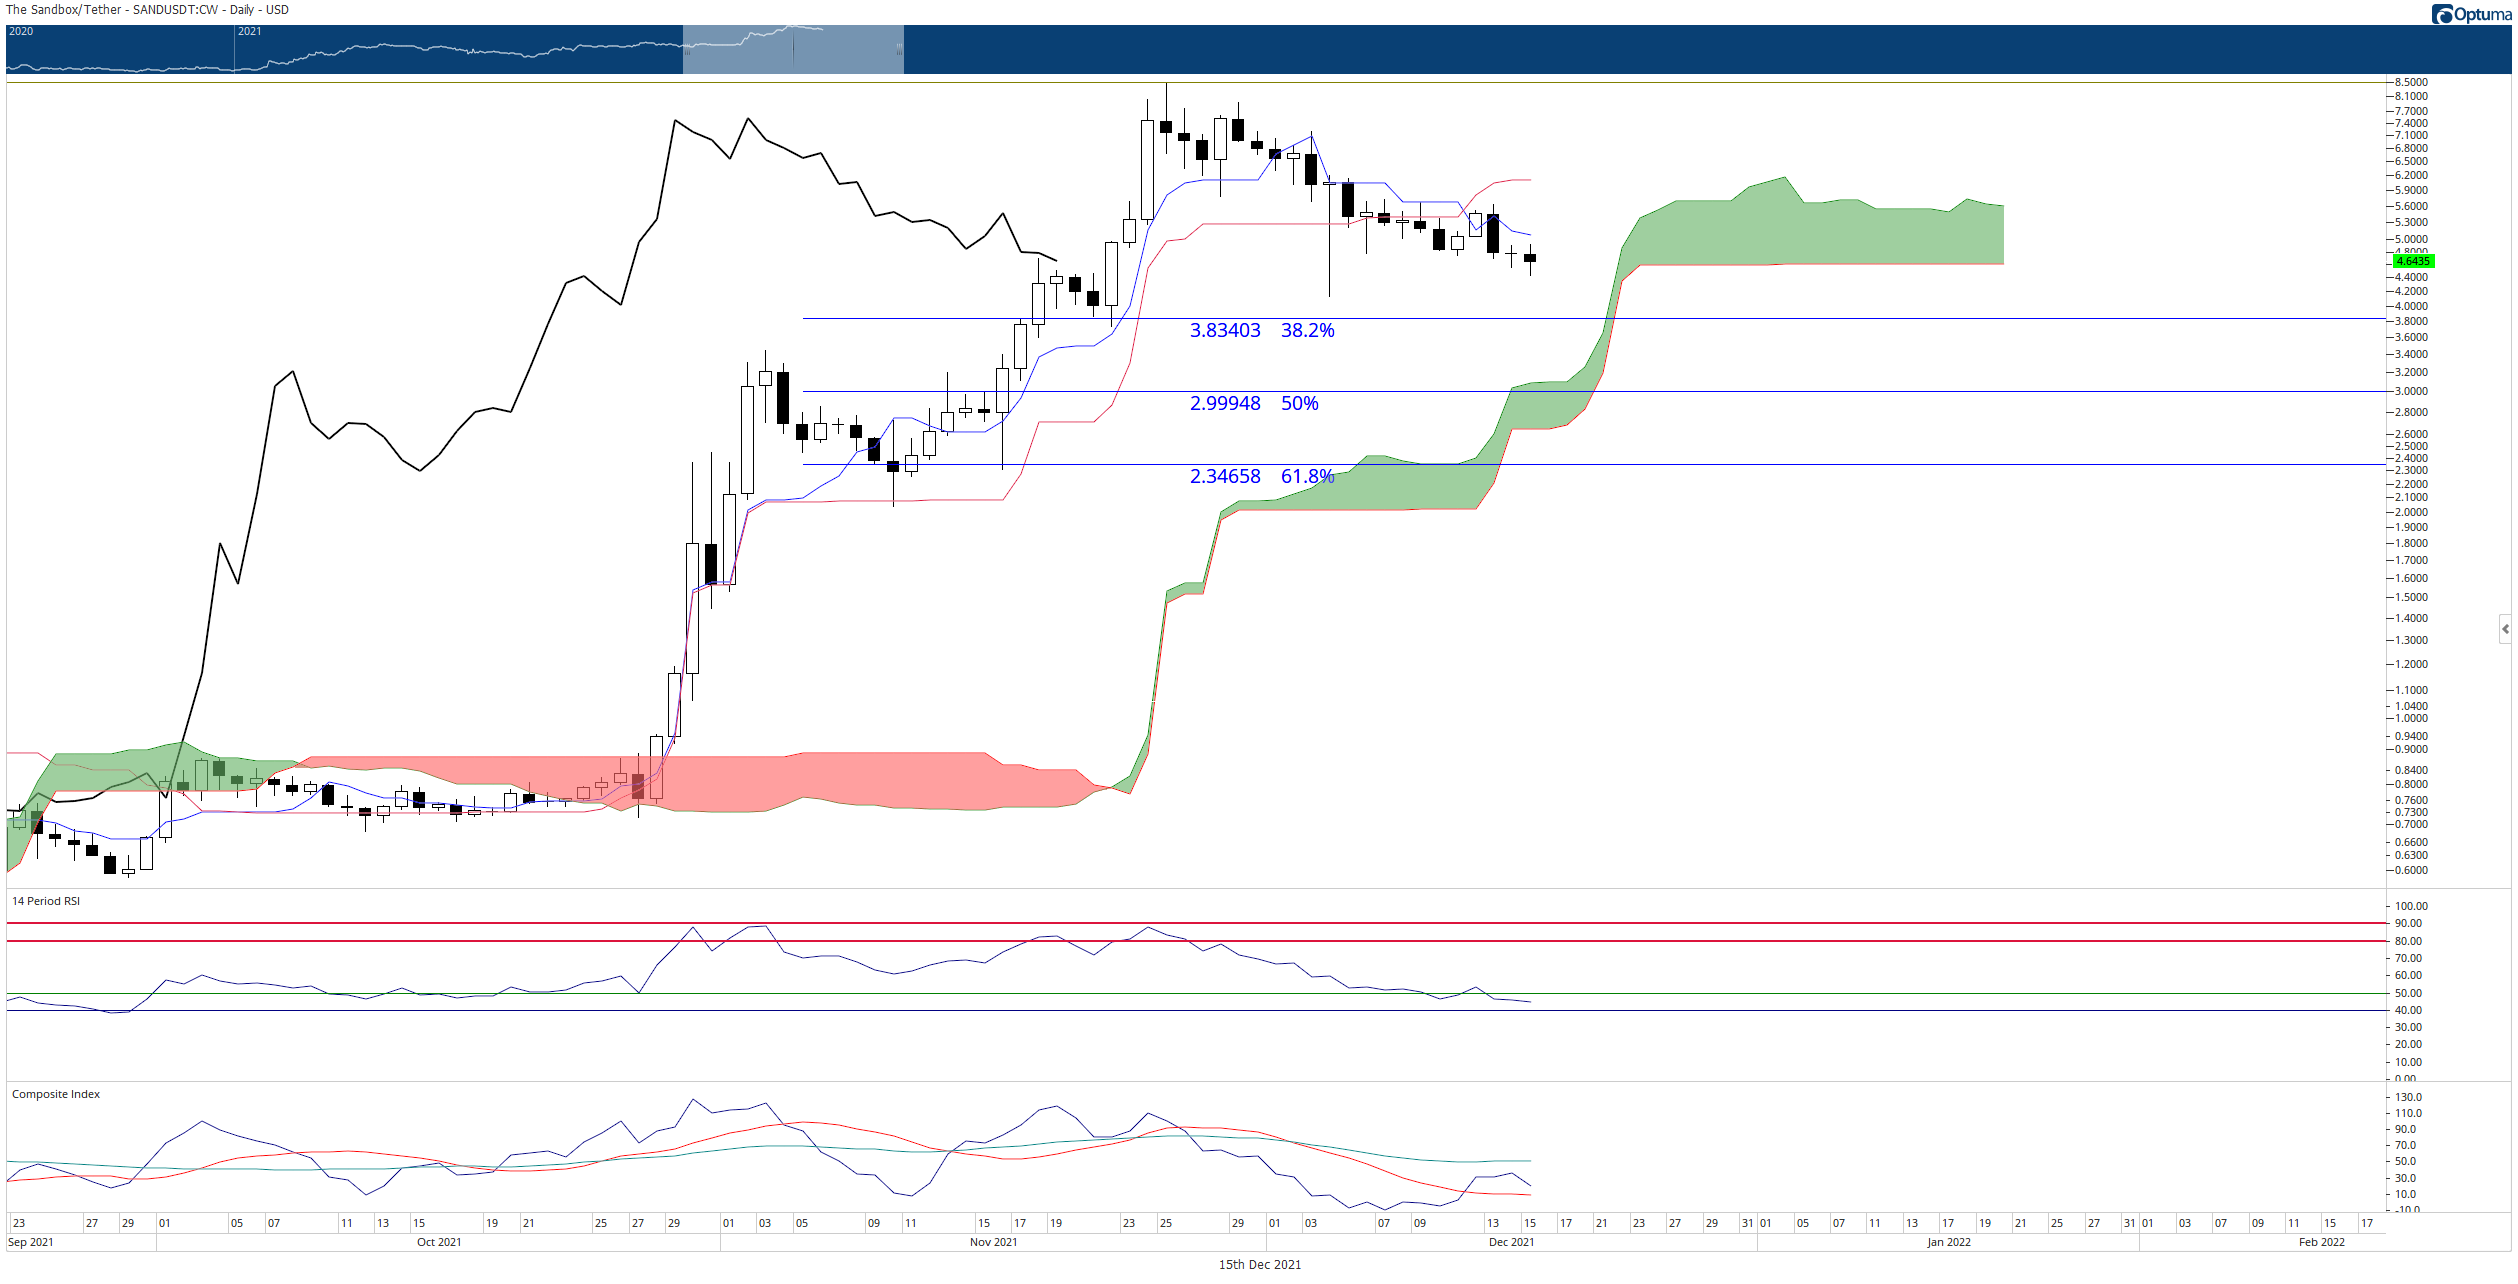
SAND/USDT Daily Ichimoku Chart
Because such a large amount of the altcoin space remains below 50% or more from its recent all-time highs, traders should expect some outflows and profit-taking of Sandbox price and other tokens in the same space. Capital will undoubtedly be transferred into cryptocurrency assets that are better positioned to experience much anticipated rallies.
Author

Jonathan Morgan
Independent Analyst
Jonathan has been working as an Independent future, forex, and cryptocurrency trader and analyst for 8 years. He also has been writing for the past 5 years.



