Sandbox hits fresh yearly high as on-chain metrics reach record highs
- The Sandbox price extends its gains on Monday and hits a fresh yearly high after rallying more than 121% in the previous week.
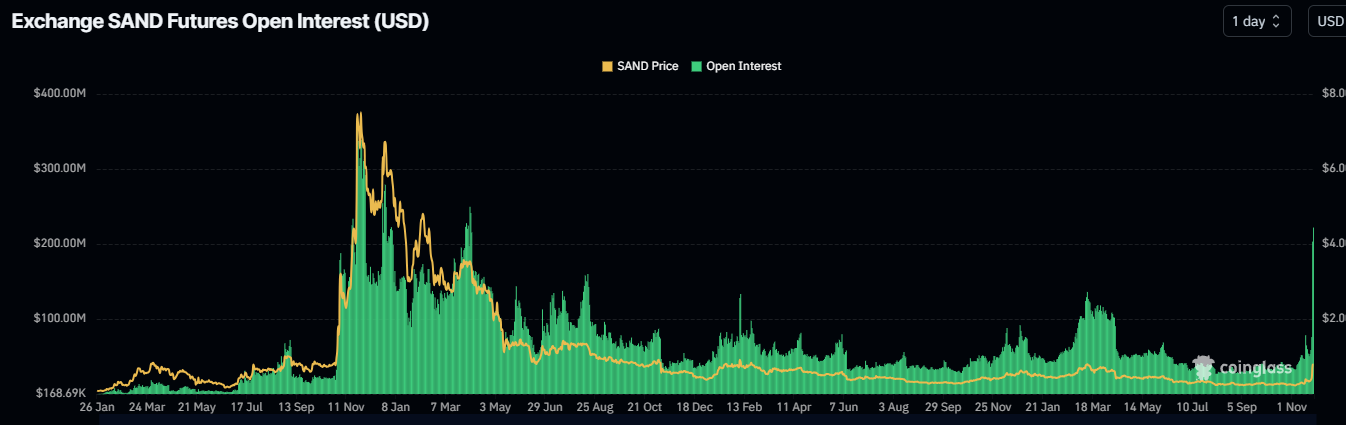
- On-chain metrics further support the raise as SAND’s open interest and weekly trading volume reach record levels.
- Santiment’s Exchange Flow Balance metric shows a negative value, indicating decreasing selling pressure and a fall in exchange supply.

The Sandbox (SAND) continued its rally and hit a fresh yearly high of $0.8680 in the early Asian session on Monday after surging over 121% last week. However, at the time of writing, SAND retraces and stabilizes around $0.7600. The bullish outlook is supported by record-breaking open interest and weekly trading volumes. The on-chain metric shows decreasing selling pressure and reduced exchange supply, signaling strong bullish momentum ahead.
Sandbox’s on-chain metrics reach record highs
The Sandbox is emerging as a major player in the growing intersection of gaming cryptocurrencies. As the gaming sector experiences significant growth, related tokens like SAND are gaining momentum, sparking anticipation of a major gaming-driven market surge, and rallied more than 121% in the previous week.
Diving deeper into its on-chain metrics provides a clearer picture. The Sandbox’s Open Interest (OI) is rising. Coinglass’s data shows that the futures’ OI in SAND at exchanges rose four times from $53.14 million on Friday to $222.01 million on Monday, the highest level since early April 2022. An increasing OI represents new or additional money entering the market and new buying, which suggests a bullish trend.
SAND’s Open Interest chart Source: Santiment
Another aspect bolstering the platform’s bullish outlook is a recent surge in traders’ interest and liquidity in the SAND chain. Santiment’s data shows that SAND’s weekly trading volume rose from $121.95 million in the third week of November to $5.41 billion the next week, the highest since the end of October 2021, when the price rallied more than 98% in a week. If history repeats, SAND’s price will rally more in the upcoming days.
%20[11.56.18,%2025%20Nov,%202024]-638681182599427405.png)
SAND’s weekly trading volume. Source: Santiment
Santiment’s Exchange Flow Balance index also aligns with the bullish outlook. This metric shows the number of SAND tokens entering and leaving the exchanges. A rise in this metric suggests that more tokens are moving into the exchange, indicating increasing selling pressure from investors as they are willing to sell. Conversely, a fall in this metric indicates more tokens are leaving the exchange and moving to cold wallets, suggesting decreasing selling pressure.
As in SAND’s case, the metric fell from 3.97 million on Thursday to -15.27 million on Sunday. This decline suggests that investors are moving out SAND tokens from the exchange, leading to a 2.5% fall in exchange supply and decreasing the selling pressure.
%20[11.43.54,%2025%20Nov,%202024]-638681182959965014.png)
SAND’s Exchange Flow Balance and Supply on Exchanges chart. Source: Santiment
Author

Manish Chhetri
FXStreet
Manish Chhetri is a crypto specialist with over four years of experience in the cryptocurrency industry.


