SafeMoon Price Forecast: SAFEMOON has no shelter, bound for a 30% drop
- SafeMoon price is being influenced by the April trend line as it tries to resolve a descending triangle pattern.
- SAFEMOON 21-day simple moving average (SMA) exerting downward pressure on price over the last month.
- Daily volume continues to languish well below the 50-day SMA, reflecting a collapse in interest for the cryptocurrency.

SafeMoon price has been coiling in a descending triangle formation since the May crash, with no high probability opportunities or upside momentum, reflecting a complete evacuation of investor interest. As descending triangles reflect a bearish bias among speculators, the outlook is tilted to the downside for the short-term.
SafeMoon price not concerned, but it should be
A descending triangle is a bearish chart formation that usually develops as a continuation pattern during a downtrend, indicating distribution. The horizontal line highlights demand that blocks the cryptocurrency from falling, while the declining trend line presents the increasing selling pressure.
The standard measured move rule for a descending triangle is to compute the height from the highest peak to the horizontal line and then add or subtract the amount to the breakout price (the point where price crosses the trend line) to get a price target. An alternative calculation is to take the amount and multiply it by the percentage of the breakouts meeting the target price. In the case of downside breakouts, 50% reach the target price.
The measured move is 57.21% based on the standard calculation, establishing a price target of $0.00000111. Alternatively, the second calculation gives a measured move of 28.64% and a price target of $0.00000186.
To trigger the descending triangle pattern, SafeMoon price needs to bust the emerging support offered by April’s descending trend line and log a daily close below $0.00000261, something it has not been able to accomplish. Once accomplished, SAFEMOON will get some support at the June 22 low of $0.00000230 before striking the first measured move price target of $0.00000186. If SafeMoon price subverts the support at $0.00000186, it may quickly drop to the April 21 low of $0.00000150 and potentially to the second measured move target of $0.00000111.
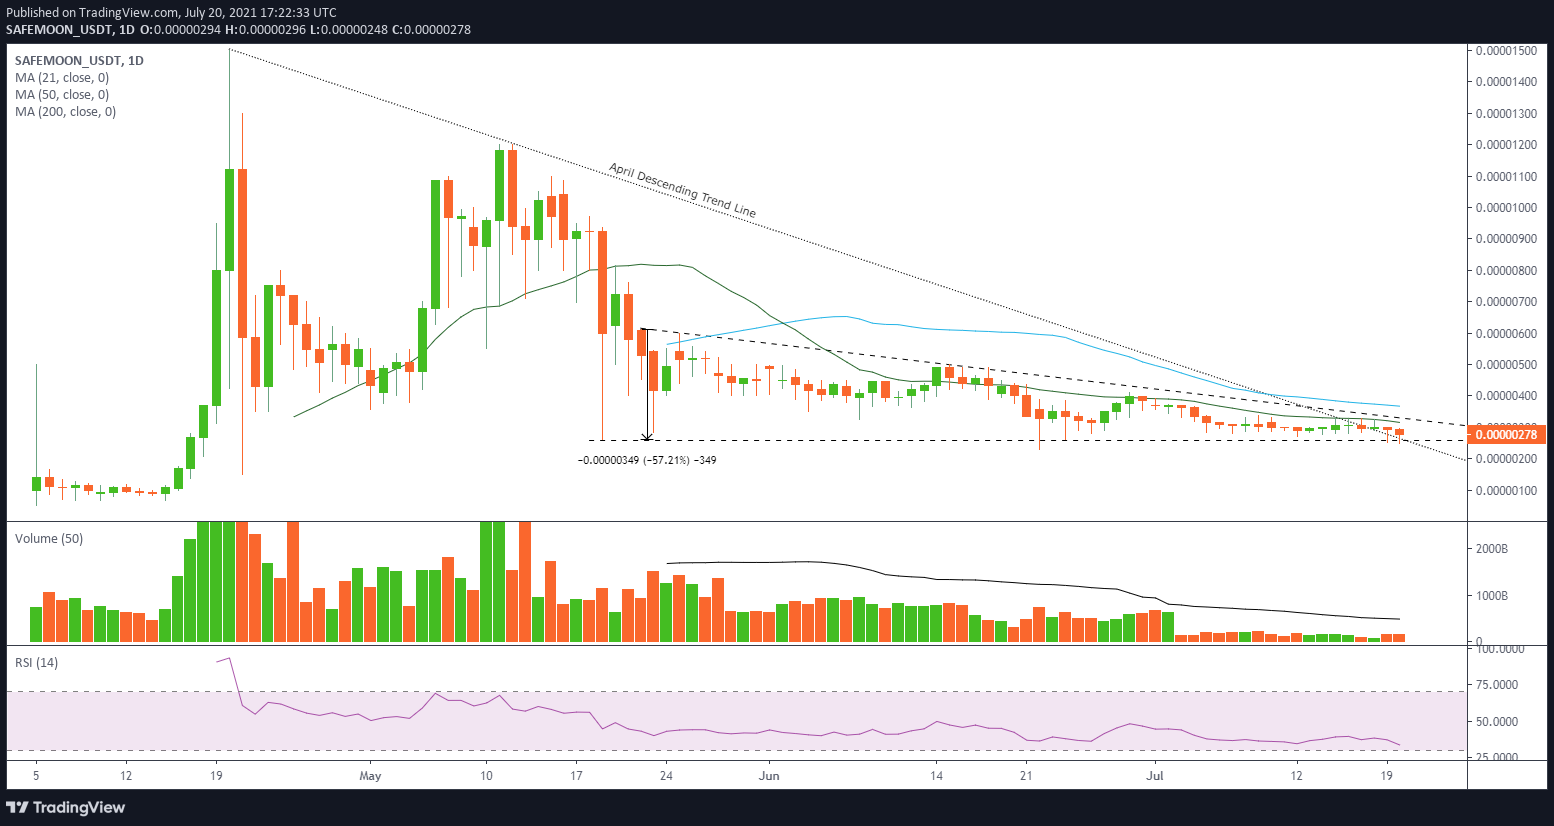
SAFEMOON/USD daily chart
An upward resolution of the pattern will need to overcome the 21-day SMA at $0.00000315, a moving average that has instructed SafeMoon price for almost a month. SAFEMOON will encounter more resistance at the triangle’s descending trend line at $0.00000330 and then the 50-day SMA at $0.00000367. Any further upside target needs to be assessed if the altcoin can reach the 50-day SMA.
SafeMoon price is on the edge of a considerable move. Still, the bearish bias of the descending triangle pattern combined with a deteriorating cryptocurrency complex tilts the probabilities in favor of a downward resolution of the pattern. To put it bluntly, it is a concerning situation for SAFEMOON speculators with the potential to unfold swiftly.
Author

Sheldon McIntyre, CMT
Independent Analyst
Sheldon has 24 years of investment experience holding various positions in companies based in the United States and Chile. His core competencies include BRIC and G-10 equity markets, swing and position trading and technical analysis.


