Ripple's XRP Technical Analysis: XRP/USD dangerous price behavior
- Ripple's XRP price on Wednesday is seen nursing losses of over 1% through the mid-point of the day.
- XRP/USD price action has formed a bearish flag pattern, which XRP continues to move within.
- At the time of writing it can be seen that the price is flirting with the lower support of the flag/channel.

XRP/USD 4-hour chart
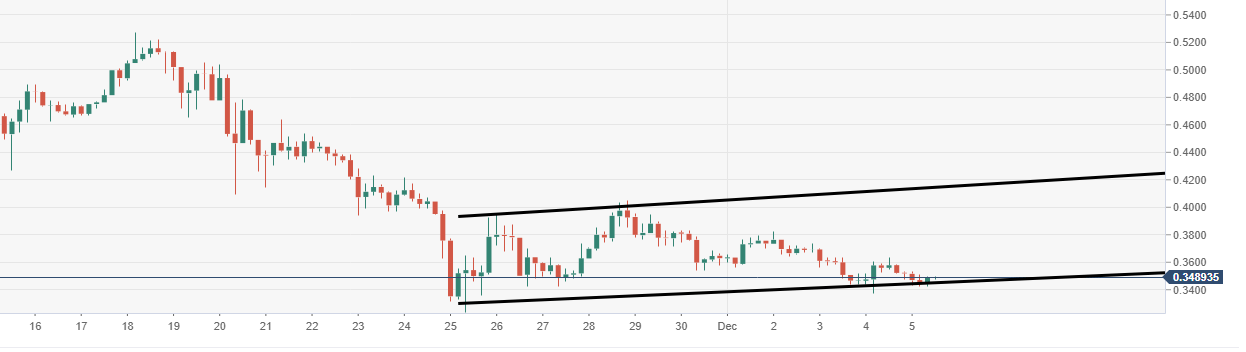
Spot rate: 0.3482
Relative change: -1.15%
High: 0.3523
Low: 0.3430
Trend: Bearish
Support 1: 0.3430, lower part of flag/channel.
Support 2: 0.3385, daily pivot point support.
Support 3: 0.3251, daily pivot point support.
Resistance 1: 0.3644, daily pivot point resistance.
Resistance 2: 0.3768, daily pivot point resistance.
Resistance 3: 0.3902, daily pivot point resistance.
Author

Ken Chigbo
Independent Analyst
Ken has over 8 years exposure to the financial markets. He started his career as an analyst, covering a variety of asset classes; forex, fixed income, commodities and equities.


