Ripple Price Prediction: XRP/USD attempts a recovery, still within a range – Confluence Detector
- XRP/USD jumped above 1-hour SMA200 but failed to hold the ground.
- Important support is created by the lower line of the channel at $0.1700.

Ripple (XRP) has been trading in a tight range since the end of June. At the time of writing, the coin is changing hands at $0.1770, having gained over 1% since the beginning of the day. XRP/USD remains sidelined as long as it stays below $0.1800. This channel resistance needs to be taken out to allow for an extended recovery. The support is created by $0.1700.
XRP/USD 1-hour chart
-637293706733457997.png)
On the intraday chart, XRP/USD attempted the recovery above 1-hour SMA200, but the upside momentum faded away on the approach to the above-mentioned channel resistance. The local support is created by a combination of 1-hour SMA50 and SMA100 at $0.1760. If it is broken, the sell-off may be extended towards $0.1700.
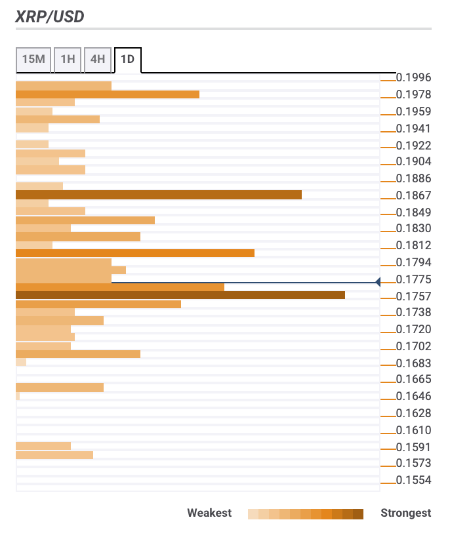
Ripple confluence levels
There are several strong technical barriers clustered both above and below the current price, which means, XRP may continue oscillating in a range for the time being. Let's have a closer look at the important support and resistance levels.
Resistance levels
$0.1800 - 23.6% Fibo retracement monthly, 161.8% Fibo projection daily, Pivot Point 1-day Resistance 2.
$0.1870 - 61.8% Fibo retracement weekly, 38.2% Fibo retracement monthly.
$0.1970 - 61.8% Fibo retracement monthly the upper line of the daily Bollinger Band.
Support levels
$0.1760 - 61.8% Fibo retracement daily, the middle line of the 1-hour Bollinger Band, 1-hour SMA100 and SMA50, the middle line of the 4-hour Bollinger Band.
$0.1700 - the lowest level of the previous month. Pivot Point 1-day Support 3.
$0.1650 - Pivot Point 1-week Support 3.
XRP/USD, 1-day
Author

Tanya Abrosimova
Independent Analyst


