XRP price could renew 25% breakout bid on surging institutional and retail adoption
- XRP price consolidates on Friday, holding support at $2.11 ahead of a potential 25% inverse head and shoulders pattern’s breakout.
- Institutional and retail interest in XRP-linked products soars, with CME Group preparing to launch XRP futures in May.
- The RSI indicator is pulling back toward the midline, indicating an increase in bearish sentiment and suggesting a potential prolonged trend reversal.

Ripple (XRP) price consolidates, trading at $2.18 at the time of writing on Friday, following mid-week gains to $2.30. The rejection from this weekly high led to the price of XRP dropping to the previous day’s low at $2.11, followed by a minor reversal. Like most cryptocurrencies, XRP shows signs of exhaustion ahead of the weekend; however, the cross-border international remittance token has the potential to shake off the bearish sentiment amid steady institutional and retail adoption.
CME Group to launch XRP futures
The world’s leading derivatives marketplace, CME Group, announced on Thursday its plan to launch XRP futures on May 19, pending regulatory review. As reported, traders will choose between a 2,500 XRP micro-sized contract and a larger 50,000 XRP contract.
According to Giovanni Vicioso, the CME Group’s Global Head of Cryptocurrency Products, the new investment vehicle will cater to the evolving digital asset landscape, which has seen a surge in interest in XRP-linked products among both institutional and retail investors.
The XRP futures will expand CME Group’s cryptocurrency products, which currently include Bitcoin futures, Ether futures, and Solana futures and options. Moreover, Coinbase derivatives launched XRP futures on Monday, offering market participants new tools to manage risk and gain exposure. This underscores the growing institutional and retail interest in XRP.
XRP price considers a 25% breakout to $2.74
XRP price holds above the 8-hour 100-day Exponential Moving Average (EMA), which sits at $2.15, and the neckline resistance level of an inverse head and shoulders pattern. Reclaiming this level as support has reaffirmed the token’s bid for a 25% breakout to $2.74, a target determined by measuring the height of the pattern from the neckline down to the head and extrapolating above the breakout point, as shown in the chart.
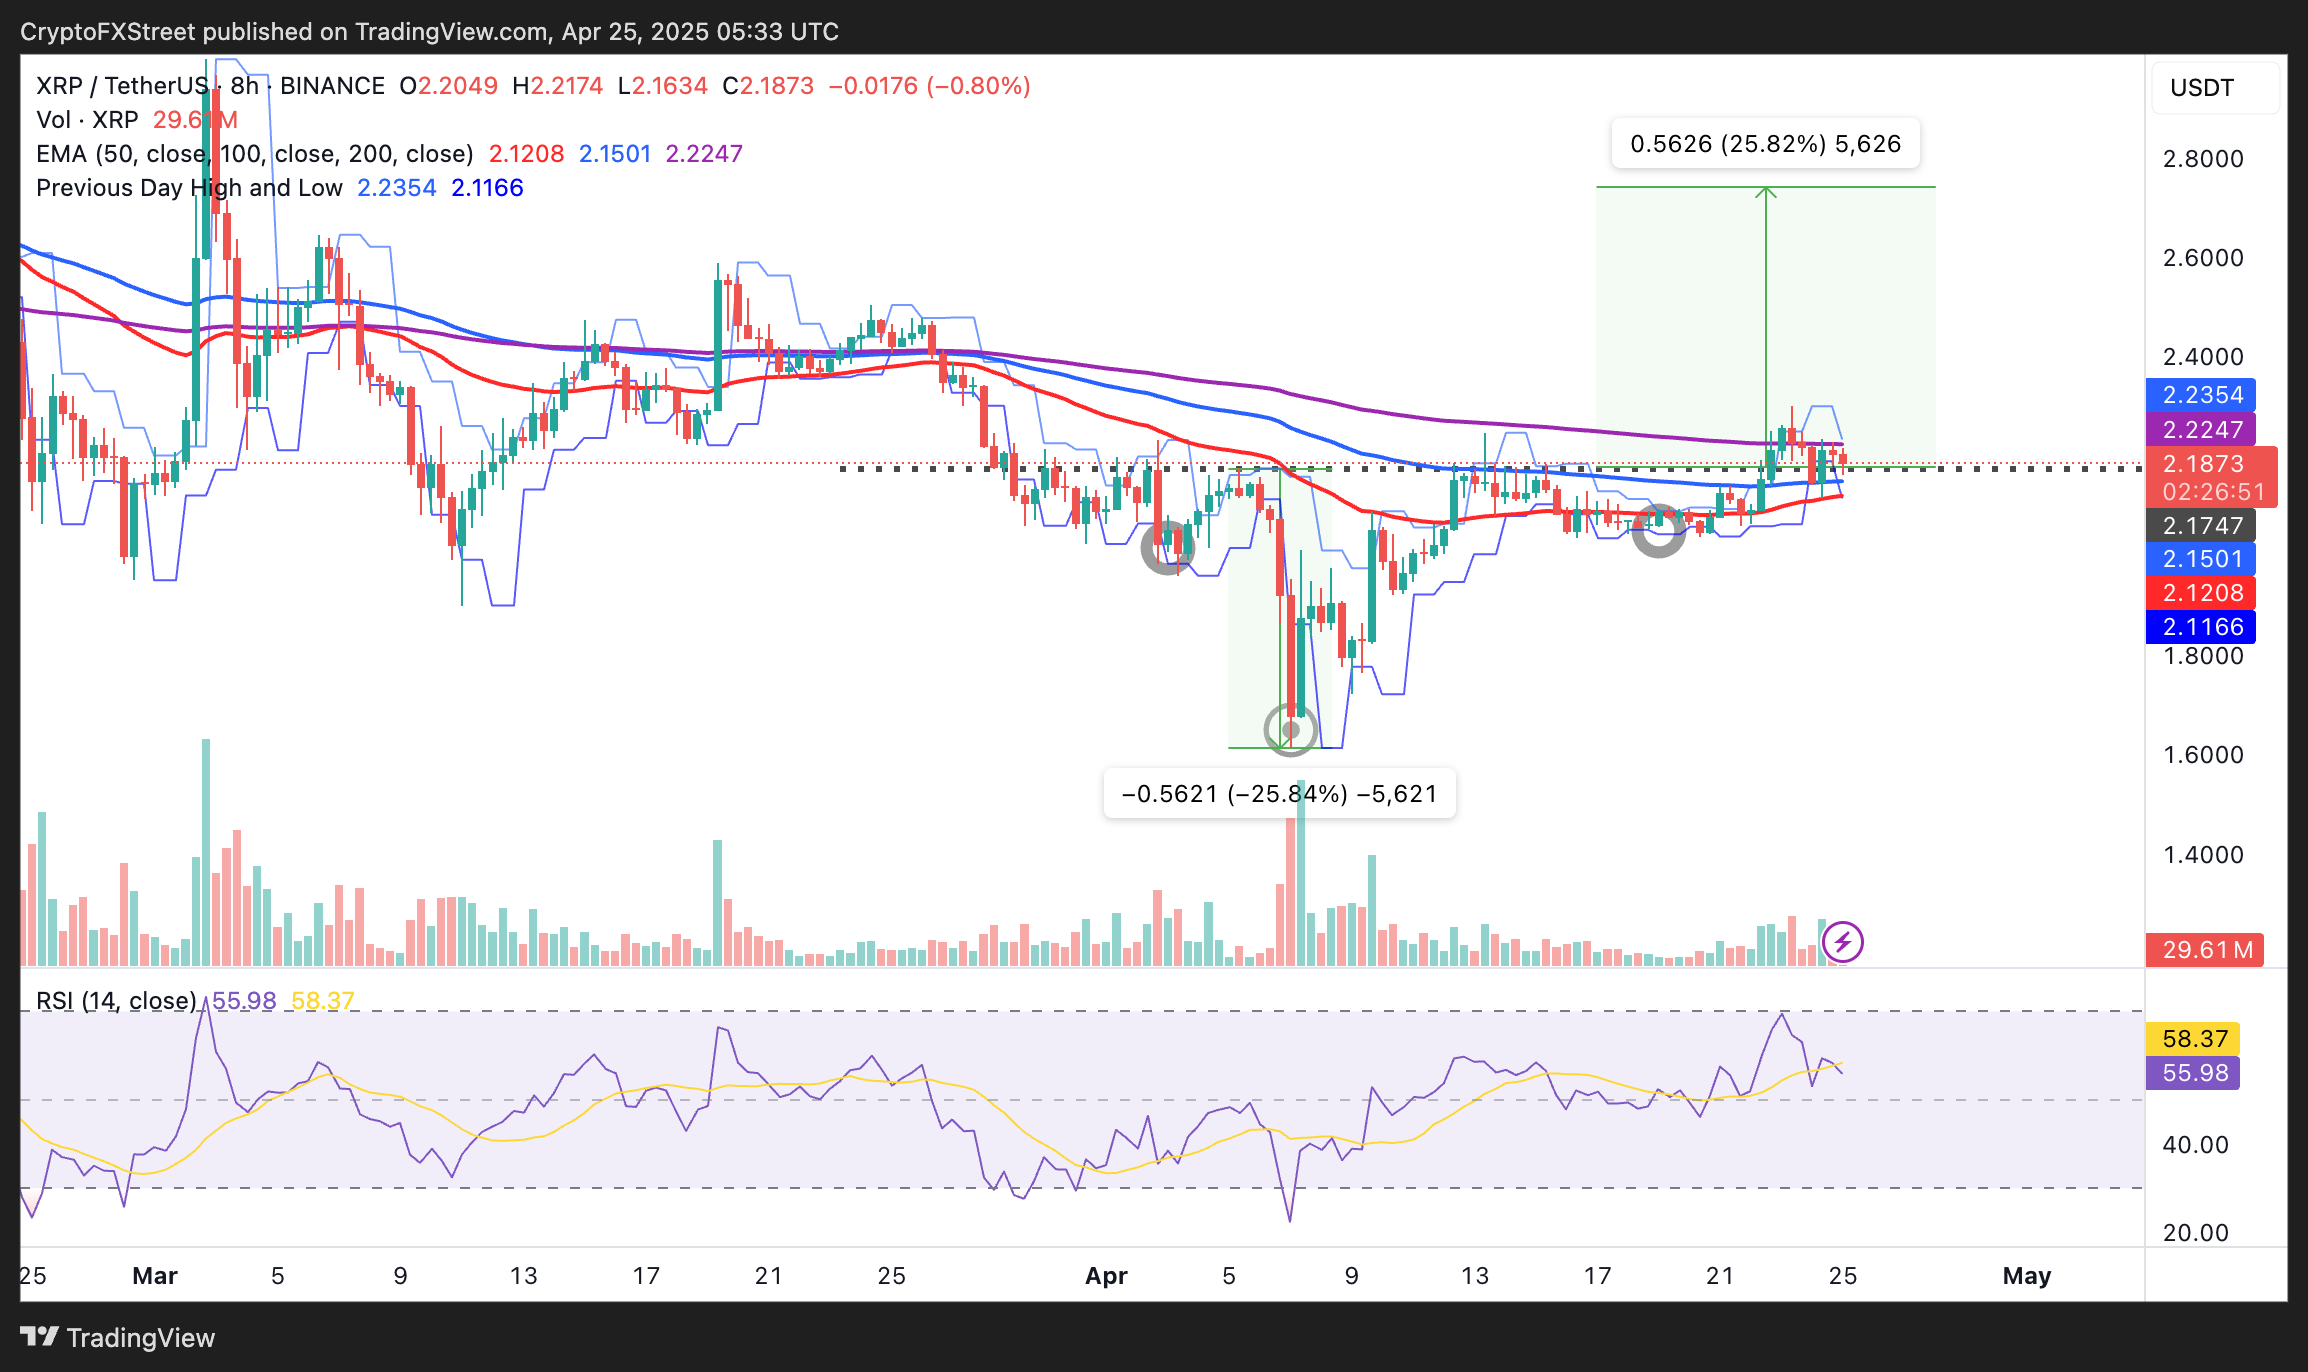
XRP/USDT 8-hour chart
Traders would look for movement above the short-term 200 EMA resistance at $2.22 to ascertain the probability of gains toward $2.74. Previous resistance at $2.50 is worth considering before going all-in on XRP.
On the flip side, the Relative Strength Index (RSI) indicator’s position at 55.98 and retracing to the midline signals fading bullish sentiment around XRP, which could accelerate the downtrend towards support at $2.00. If the RSI indicator drops below the centerline, the XRP price might tumble amid heightened sell-side pressure.
According to Coinglass, the decline in Open Interest (OI) by 0.21% to $3.86 billion in the last 24 hours signals waning confidence or a lack of strong conviction among traders during the current consolidation phase.
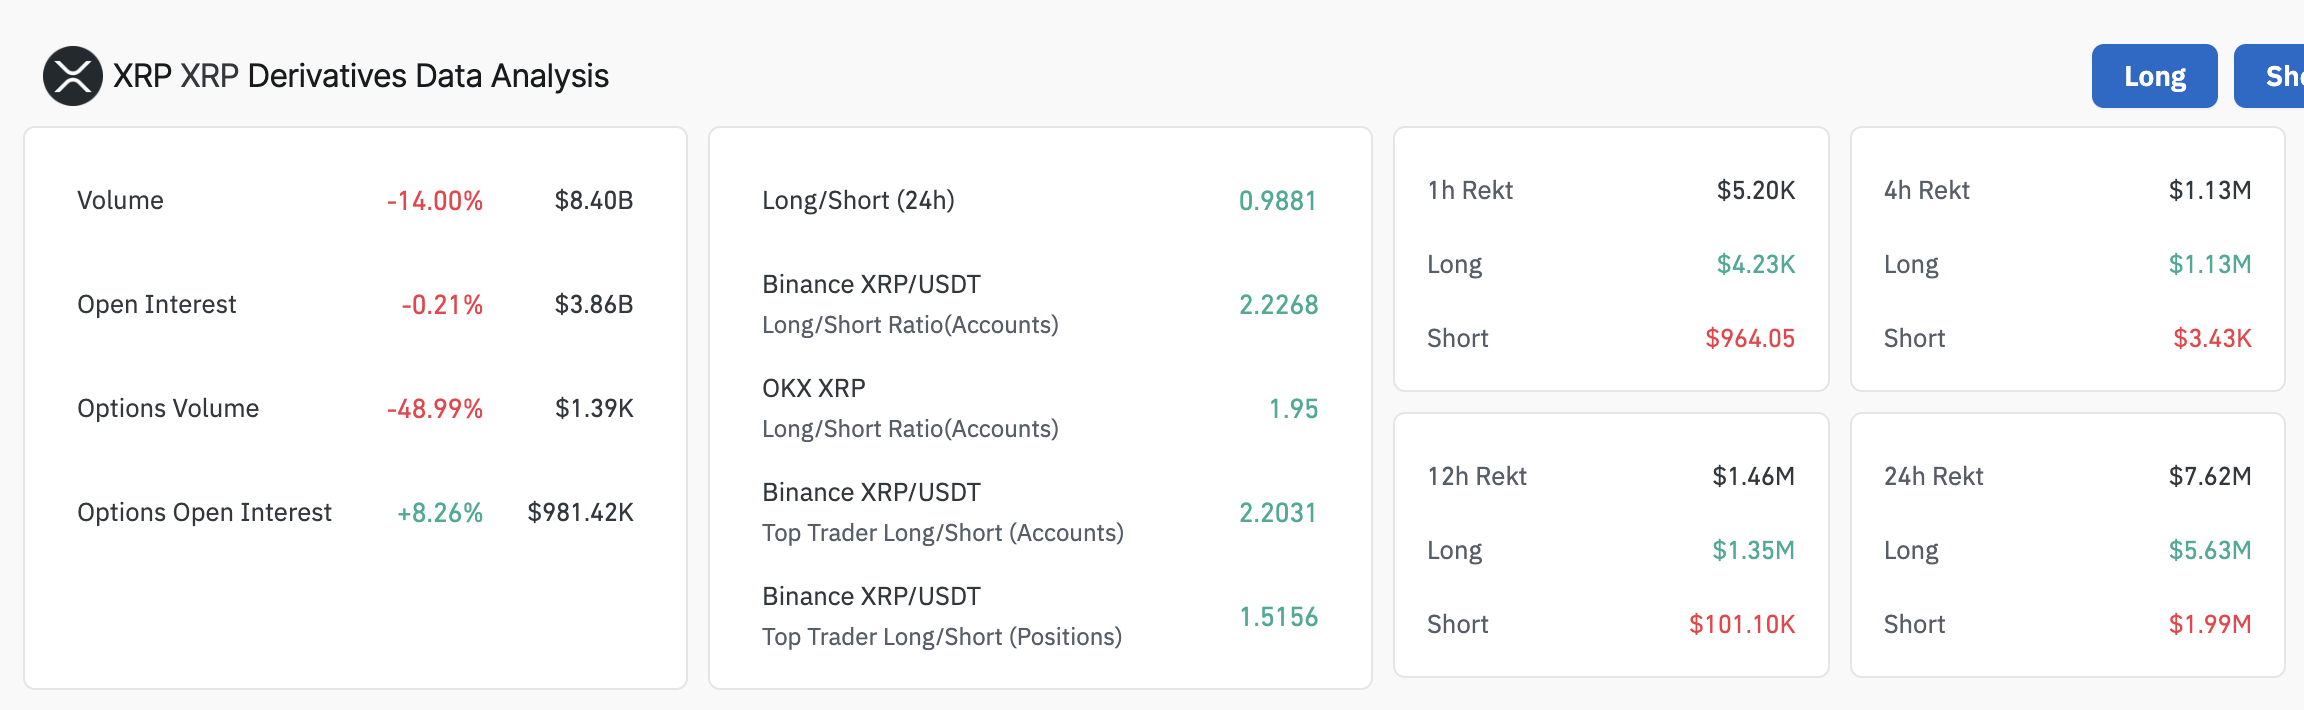
XRP derivatives data | Source: Coinglass
Long liquidations outweigh shorts, hinting at mounting bearish pressure. Over the past 24 hours, long liquidations totaled $5.63 million, compared to $1.99 million in short liquidations, indicating that bullish traders face greater pressure as their positions are forcibly closed. The 4-hour liquidations data reinforce the bearish sentiment, with $1.13 million in long positions liquidated compared to approximately $3,430 in short positions.
Cryptocurrency prices FAQs
Token launches influence demand and adoption among market participants. Listings on crypto exchanges deepen the liquidity for an asset and add new participants to an asset’s network. This is typically bullish for a digital asset.
A hack is an event in which an attacker captures a large volume of the asset from a DeFi bridge or hot wallet of an exchange or any other crypto platform via exploits, bugs or other methods. The exploiter then transfers these tokens out of the exchange platforms to ultimately sell or swap the assets for other cryptocurrencies or stablecoins. Such events often involve an en masse panic triggering a sell-off in the affected assets.
Macroeconomic events like the US Federal Reserve’s decision on interest rates influence crypto assets mainly through the direct impact they have on the US Dollar. An increase in interest rate typically negatively influences Bitcoin and altcoin prices, and vice versa. If the US Dollar index declines, risk assets and associated leverage for trading gets cheaper, in turn driving crypto prices higher.
Halvings are typically considered bullish events as they slash the block reward in half for miners, constricting the supply of the asset. At consistent demand if the supply reduces, the asset’s price climbs.
Author

John Isige
FXStreet
John Isige is a seasoned cryptocurrency journalist and markets analyst committed to delivering high-quality, actionable insights tailored to traders, investors, and crypto enthusiasts. He enjoys deep dives into emerging Web3 tren


