Ripple price forecast: XRP price could hit $1.76 this week amid potential 20% correction
- XRP technical indicators on the daily price chart support the likelihood of further correction.
- XRP extends its losses by nearly 1% on Monday, with bears eyeing the $1.7600 support level, which has been in place for nearly six months.
- XRP investment products led altcoins, with over $28 million in outflows last week.

Ripple (XRP) faces legal uncertainty in its battle with the United States (US) Securities and Exchange Commission (SEC), and the XRP price continues to slide. At the time of writing, XRP is trading at $2.1540, down 1.20% in the day.
Bitcoin’s consolidation has led to uncertainty among crypto traders, and the risk-off sentiment is evident from outflows piling into XRP investment products.
XRP traders need to watch the daily price chart closely for signs of reversal in the altcoin’s price trend this week.
XRP technical analysis
While Ripple tackles its legal battle with the SEC, an unexpected third party has submitted a filing questioning the interpretation of the Howey Test, raising concerns in the lawsuit. The daily price chart suggests further decline is likely in XRP amidst legal issues.
XRP has consolidated under the $2.7000 resistance for nearly three months. Key support levels are $2.0350, the 23.6% Fibonacci retracement of the decline from the $3.4000 top to the $1.6134 low, and $1.7600, a key support that held for nearly six months.
An 18% drop could see XRP test support at $1.7600 if the altcoin extends losses this week.
The Relative Strength Index (RSI) and Moving Average Convergence Divergence (MACD) support a bearish thesis for XRP. RSI reads 39 and is sloping downward, and MACD flashes red histogram bars under the neutral line.
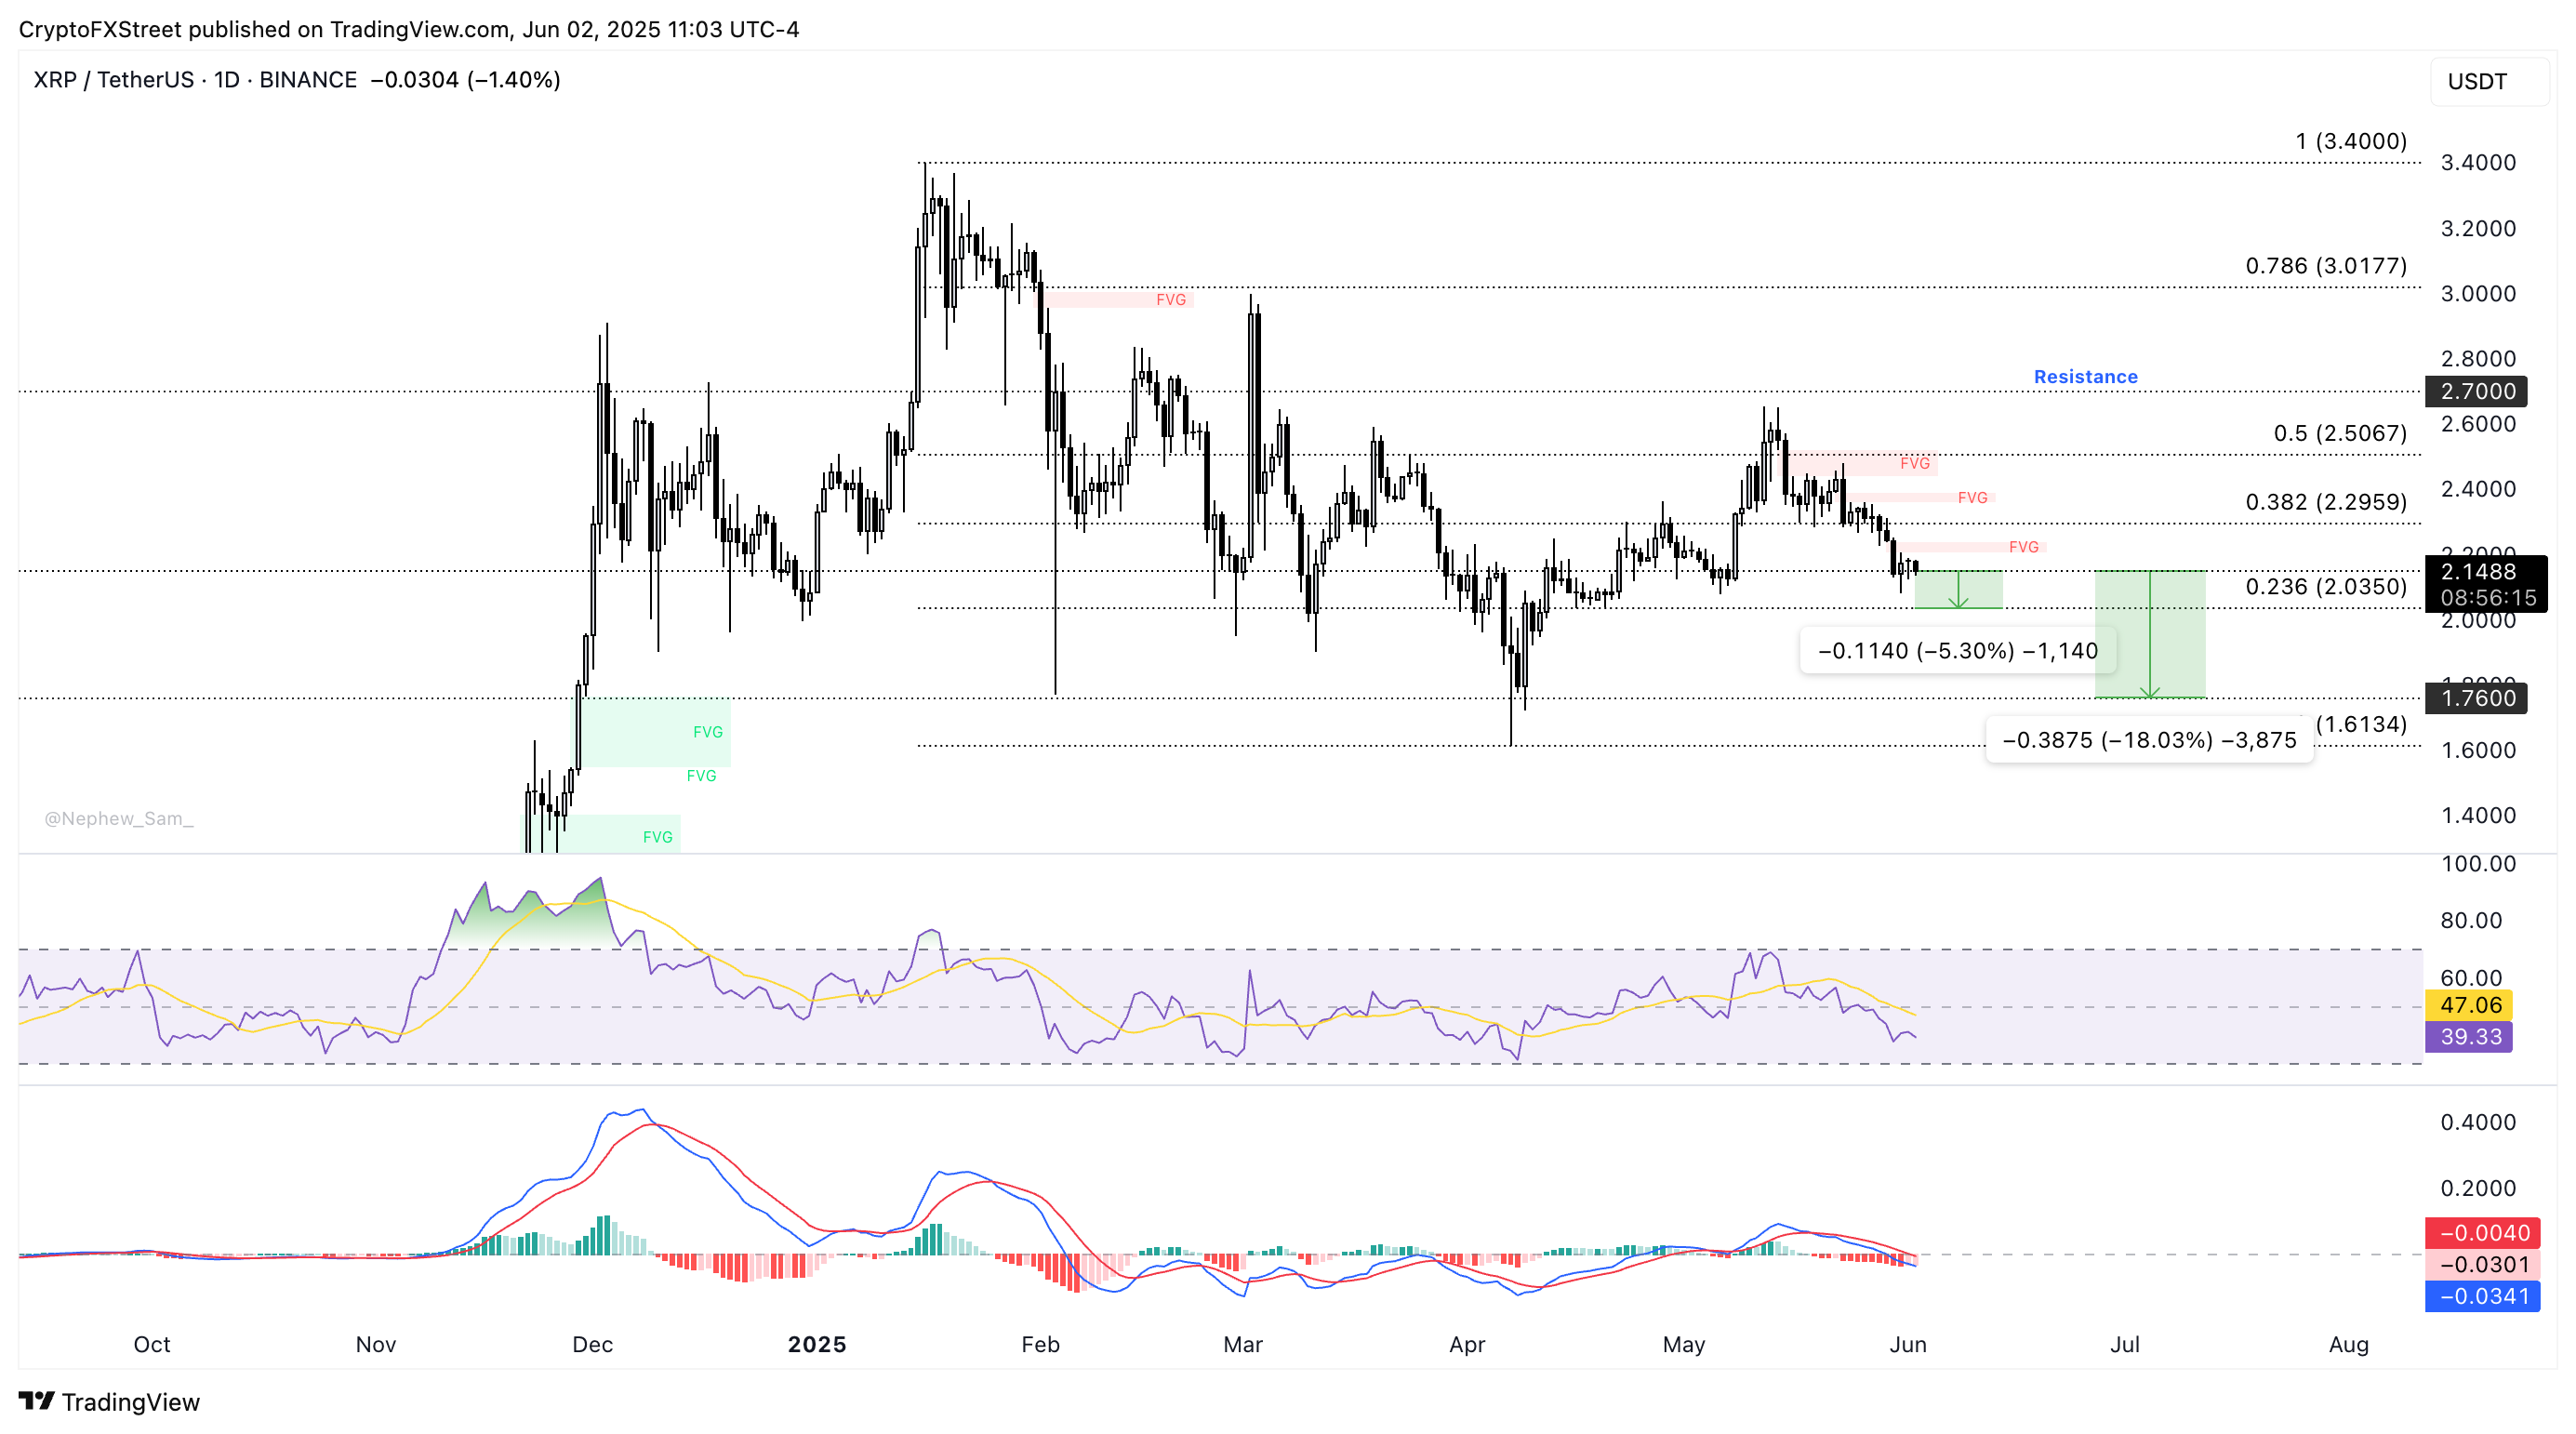
XRP/USDT daily price chart | Source: TradingView
Conversely, key resistances are 38.2% Fibonacci retracement level and the 50% Fibonacci placeholder at $2.2959 and $2.5067.
Market overview: Catalysts influencing Ripple lawsuit, XRP price
The new filing that emerged in the SEC vs. Ripple lawsuit has prompted pro-crypto attorneys to comment on the uncertainty in the legal battle’s resolution.
Other factors like rising outflows in XRP-focused investment funds, $28 million last week, as recorded by the CoinShares Digital Assets fund flows report, are influencing the sentiment among XRP holders and market participants.
The report shows that XRP led losses among altcoins while Ethereum led the gains.
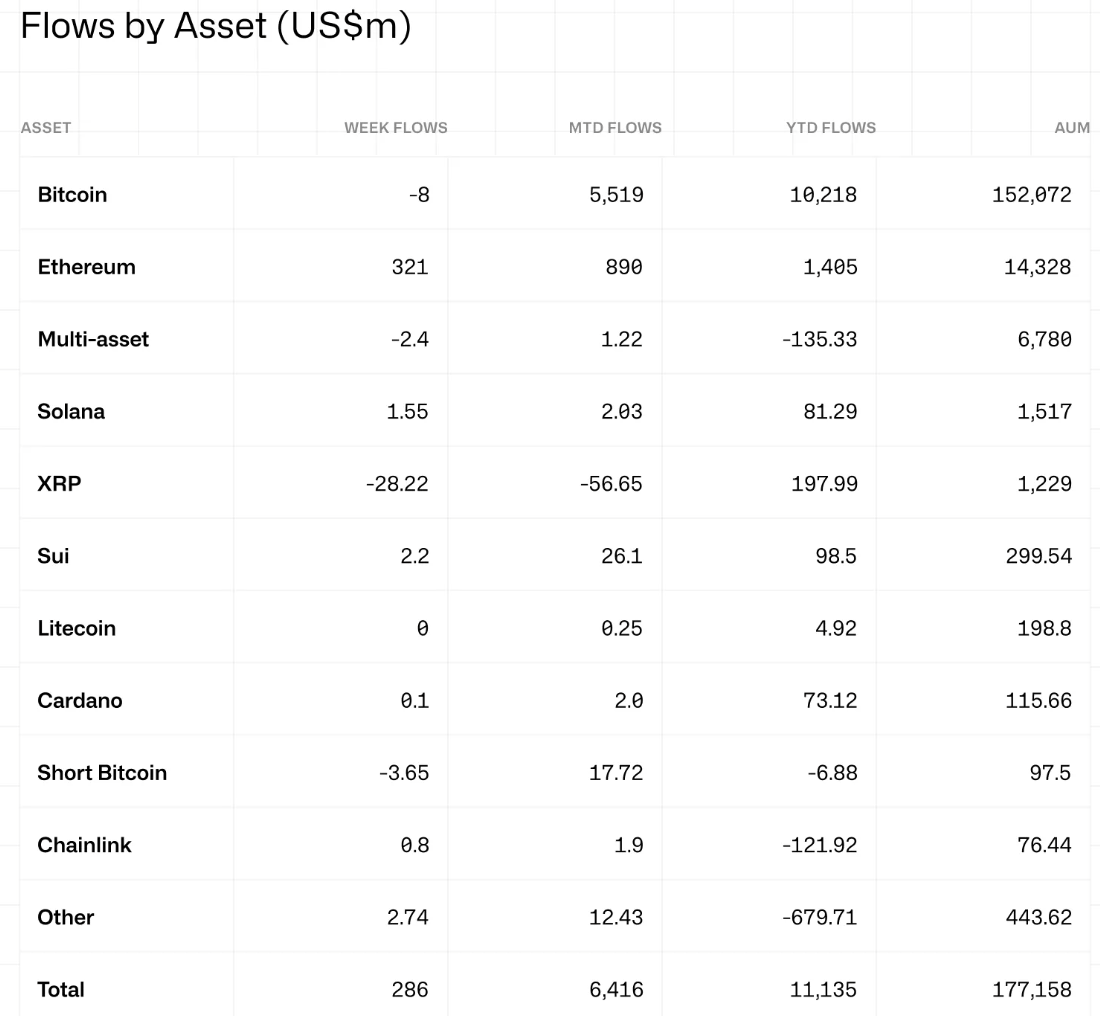
Crypto asset weekly flows | Source: CoinShares
Typically, outflows support a bearish thesis and represent a declining interest and investor participation, while inflows signal rising demand and support a bullish thesis.
Cryptocurrency metrics FAQs
The developer or creator of each cryptocurrency decides on the total number of tokens that can be minted or issued. Only a certain number of these assets can be minted by mining, staking or other mechanisms. This is defined by the algorithm of the underlying blockchain technology. On the other hand, circulating supply can also be decreased via actions such as burning tokens, or mistakenly sending assets to addresses of other incompatible blockchains.
Market capitalization is the result of multiplying the circulating supply of a certain asset by the asset’s current market value.
Trading volume refers to the total number of tokens for a specific asset that has been transacted or exchanged between buyers and sellers within set trading hours, for example, 24 hours. It is used to gauge market sentiment, this metric combines all volumes on centralized exchanges and decentralized exchanges. Increasing trading volume often denotes the demand for a certain asset as more people are buying and selling the cryptocurrency.
Funding rates are a concept designed to encourage traders to take positions and ensure perpetual contract prices match spot markets. It defines a mechanism by exchanges to ensure that future prices and index prices periodic payments regularly converge. When the funding rate is positive, the price of the perpetual contract is higher than the mark price. This means traders who are bullish and have opened long positions pay traders who are in short positions. On the other hand, a negative funding rate means perpetual prices are below the mark price, and hence traders with short positions pay traders who have opened long positions.
Author

Ekta Mourya
FXStreet
Ekta Mourya has extensive experience in fundamental and on-chain analysis, particularly focused on impact of macroeconomics and central bank policies on cryptocurrencies.


