XRP rebounds as retail demand shows signs of returning
- XRP bulls test recovery potential near $1.10 after holding support at $1.07.
- Retail demand remains steady, with perpetual futures Open Interest averaging 2.14 billion XRP.
- XRP’s technical indicators continue to signal weakness, with persistent declines in key moving averages exerting downward pressure on price action.

Ripple (XRP) exhibits a subtle rebound outlook, trading near $1.10 at the time of writing on Thursday. The headwinds in the crypto market are largely attributable to mounting investor uncertainty amid renewed tensions in the Middle East.
US and Iran exchange fire as tensions escalate
Geopolitical tensions escalated after the United States (US) military announced strikes on 90 targets along Iran’s coastline late Wednesday. In retaliation, Iran’s Revolutionary Guard launched attacks on US military bases in Kuwait and Bahrain.
Despite the attacks, Qatar’s Prime Minister urged both Iranian and US officials to pursue dialogue, according to Reuters.
XRP sees modest retail demand
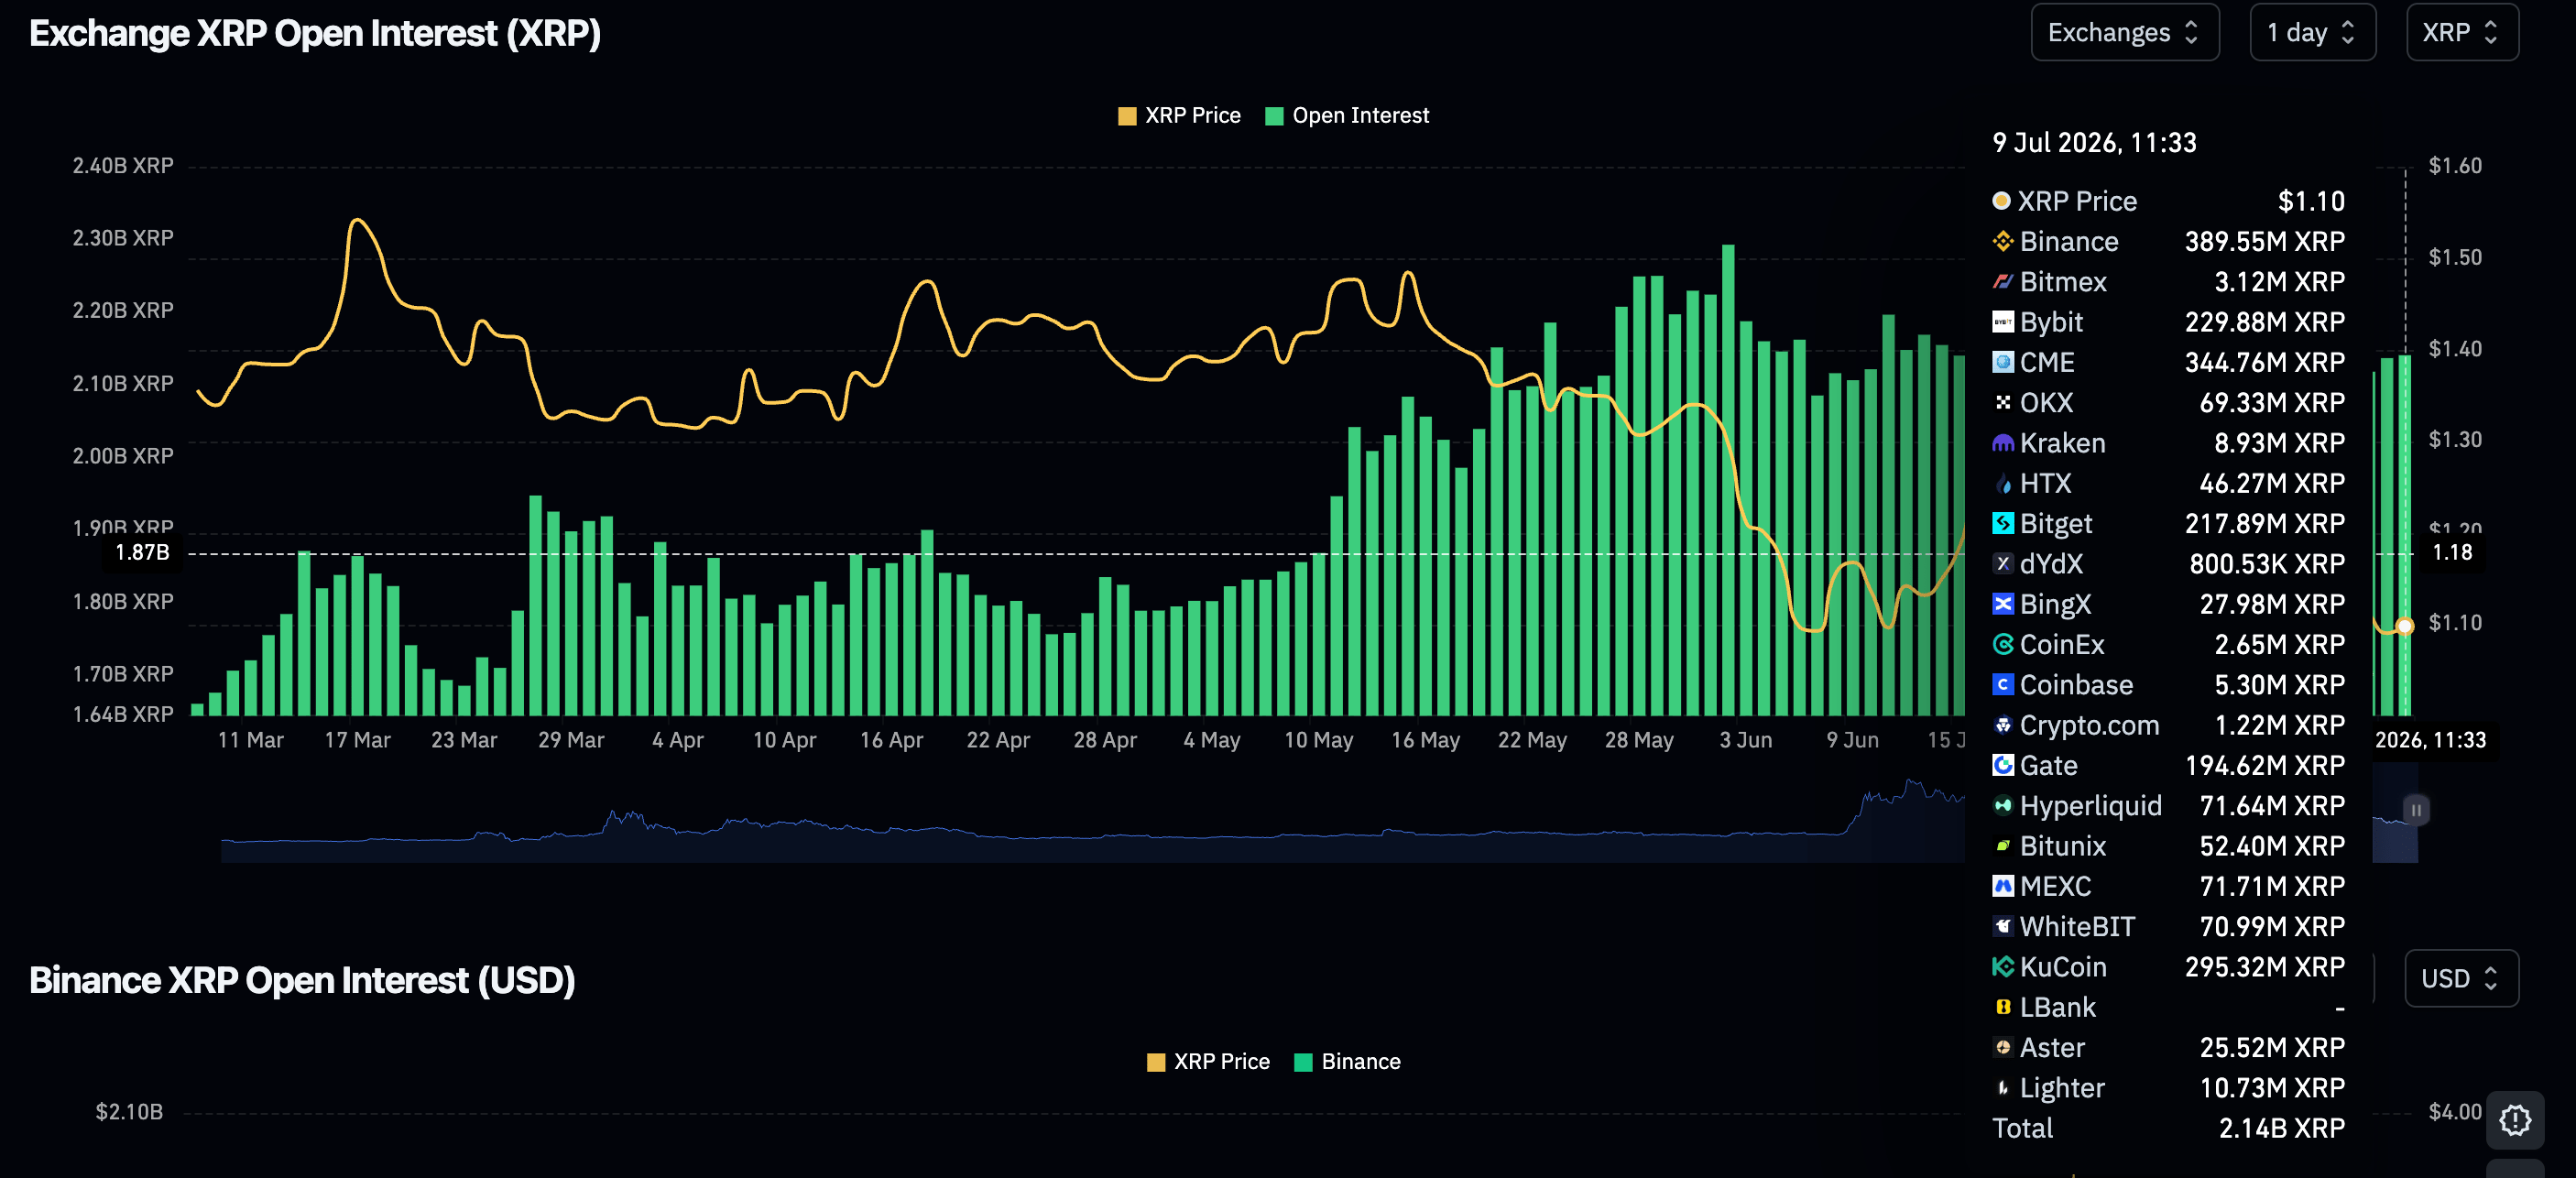
XRP continues to attract modest retail demand in the derivatives market. According to CoinGlass data, perpetual futures Open Interest (OI) holds steady around 2.14 billion XRP on Thursday. An expanded outlook shows that OI has risen from the 2.09 billion XRP recorded on Tuesday. If sustained, growing retail demand could back the ongoing rebound.
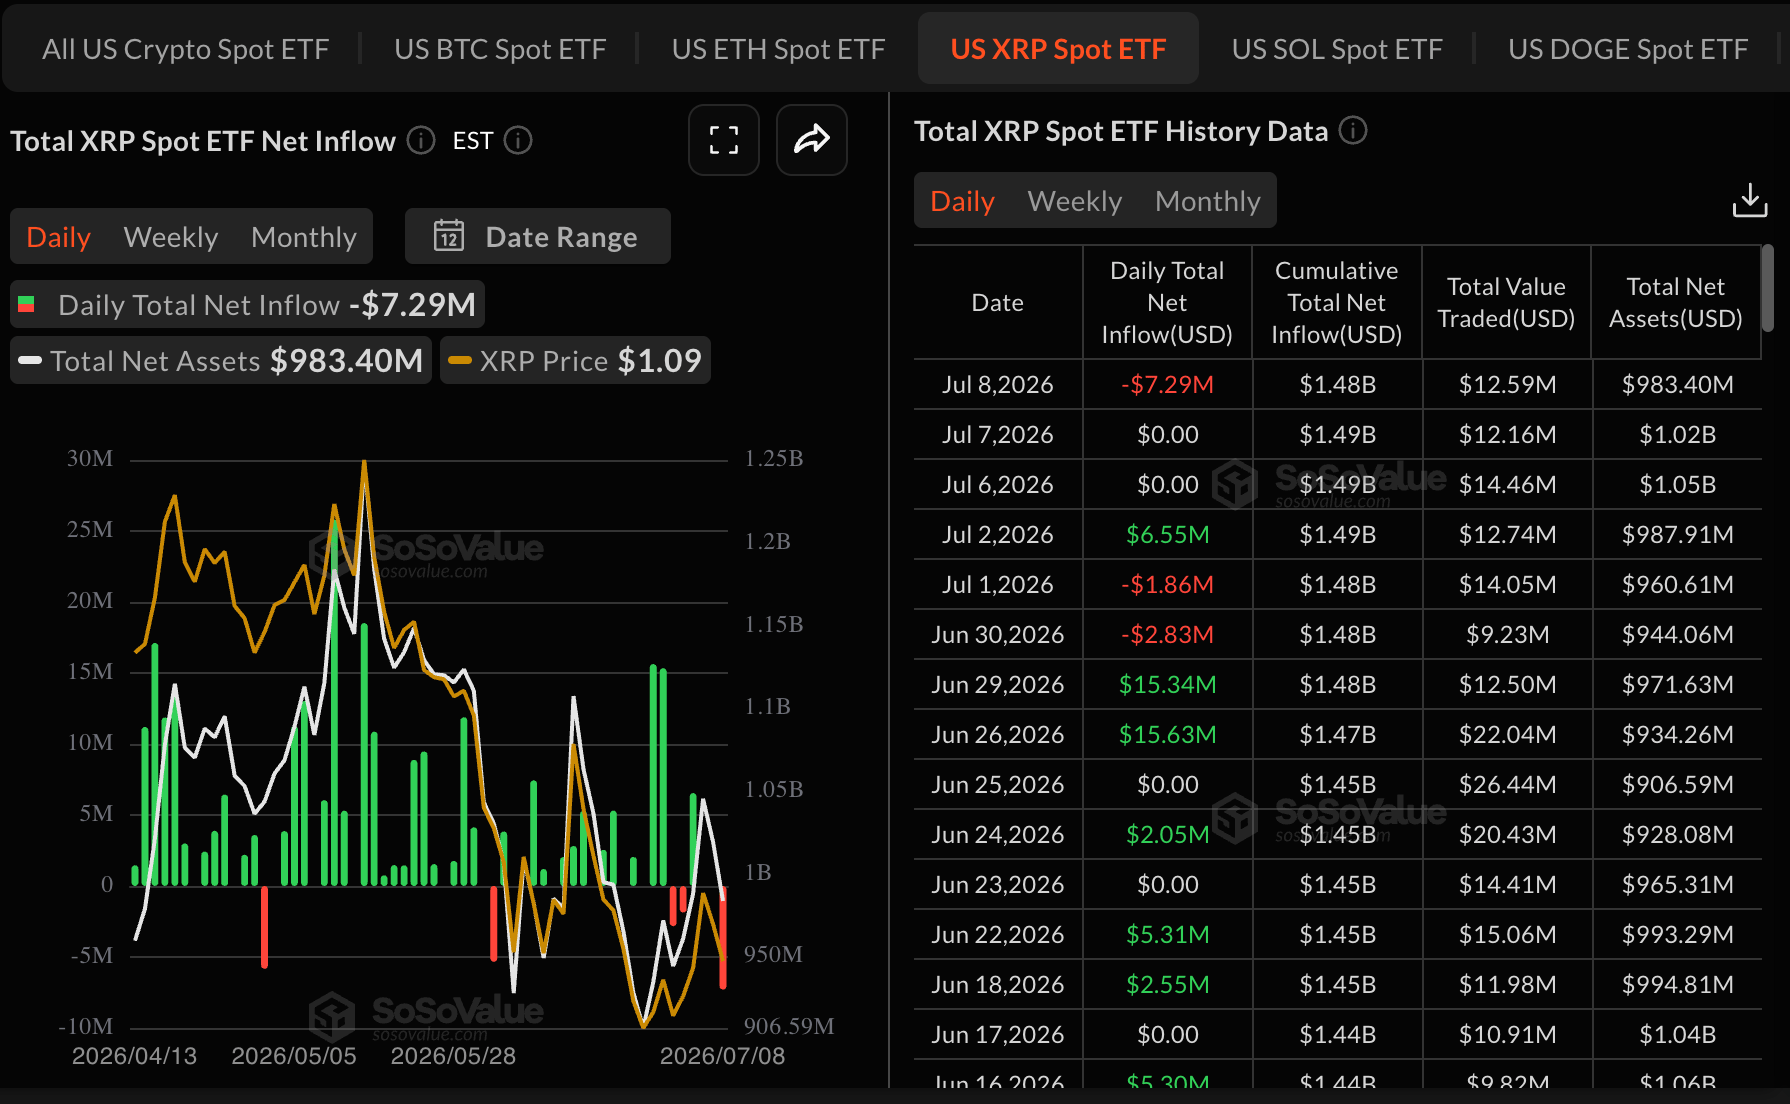
Nevertheless, institutional investors remain cautious, as reflected in XRP spot Exchange-Traded Funds (ETFs) outflows totaling roughly $7 billion on Wednesday, following muted activity on Tuesday and Monday.
Price analysis: XRP pares losses as bulls eye short-term recovery
XRP maintains a bearish near-term bias as the pair holds well below the 50-day, 100-day and 200-day Exponential Moving Averages (EMAs). The downward-sloping resistance trendline remains dominant, with its break price at $1.15 now acting as an immediate cap.
Momentum is relatively constructive but not decisive, as the Relative Strength Index (RSI) hovering near 45 stays below the midline on the daily chart while the Moving Average Convergence Divergence (MACD) histogram shows a positive outlook, hinting at a tentative recovery within a broader capped structure.
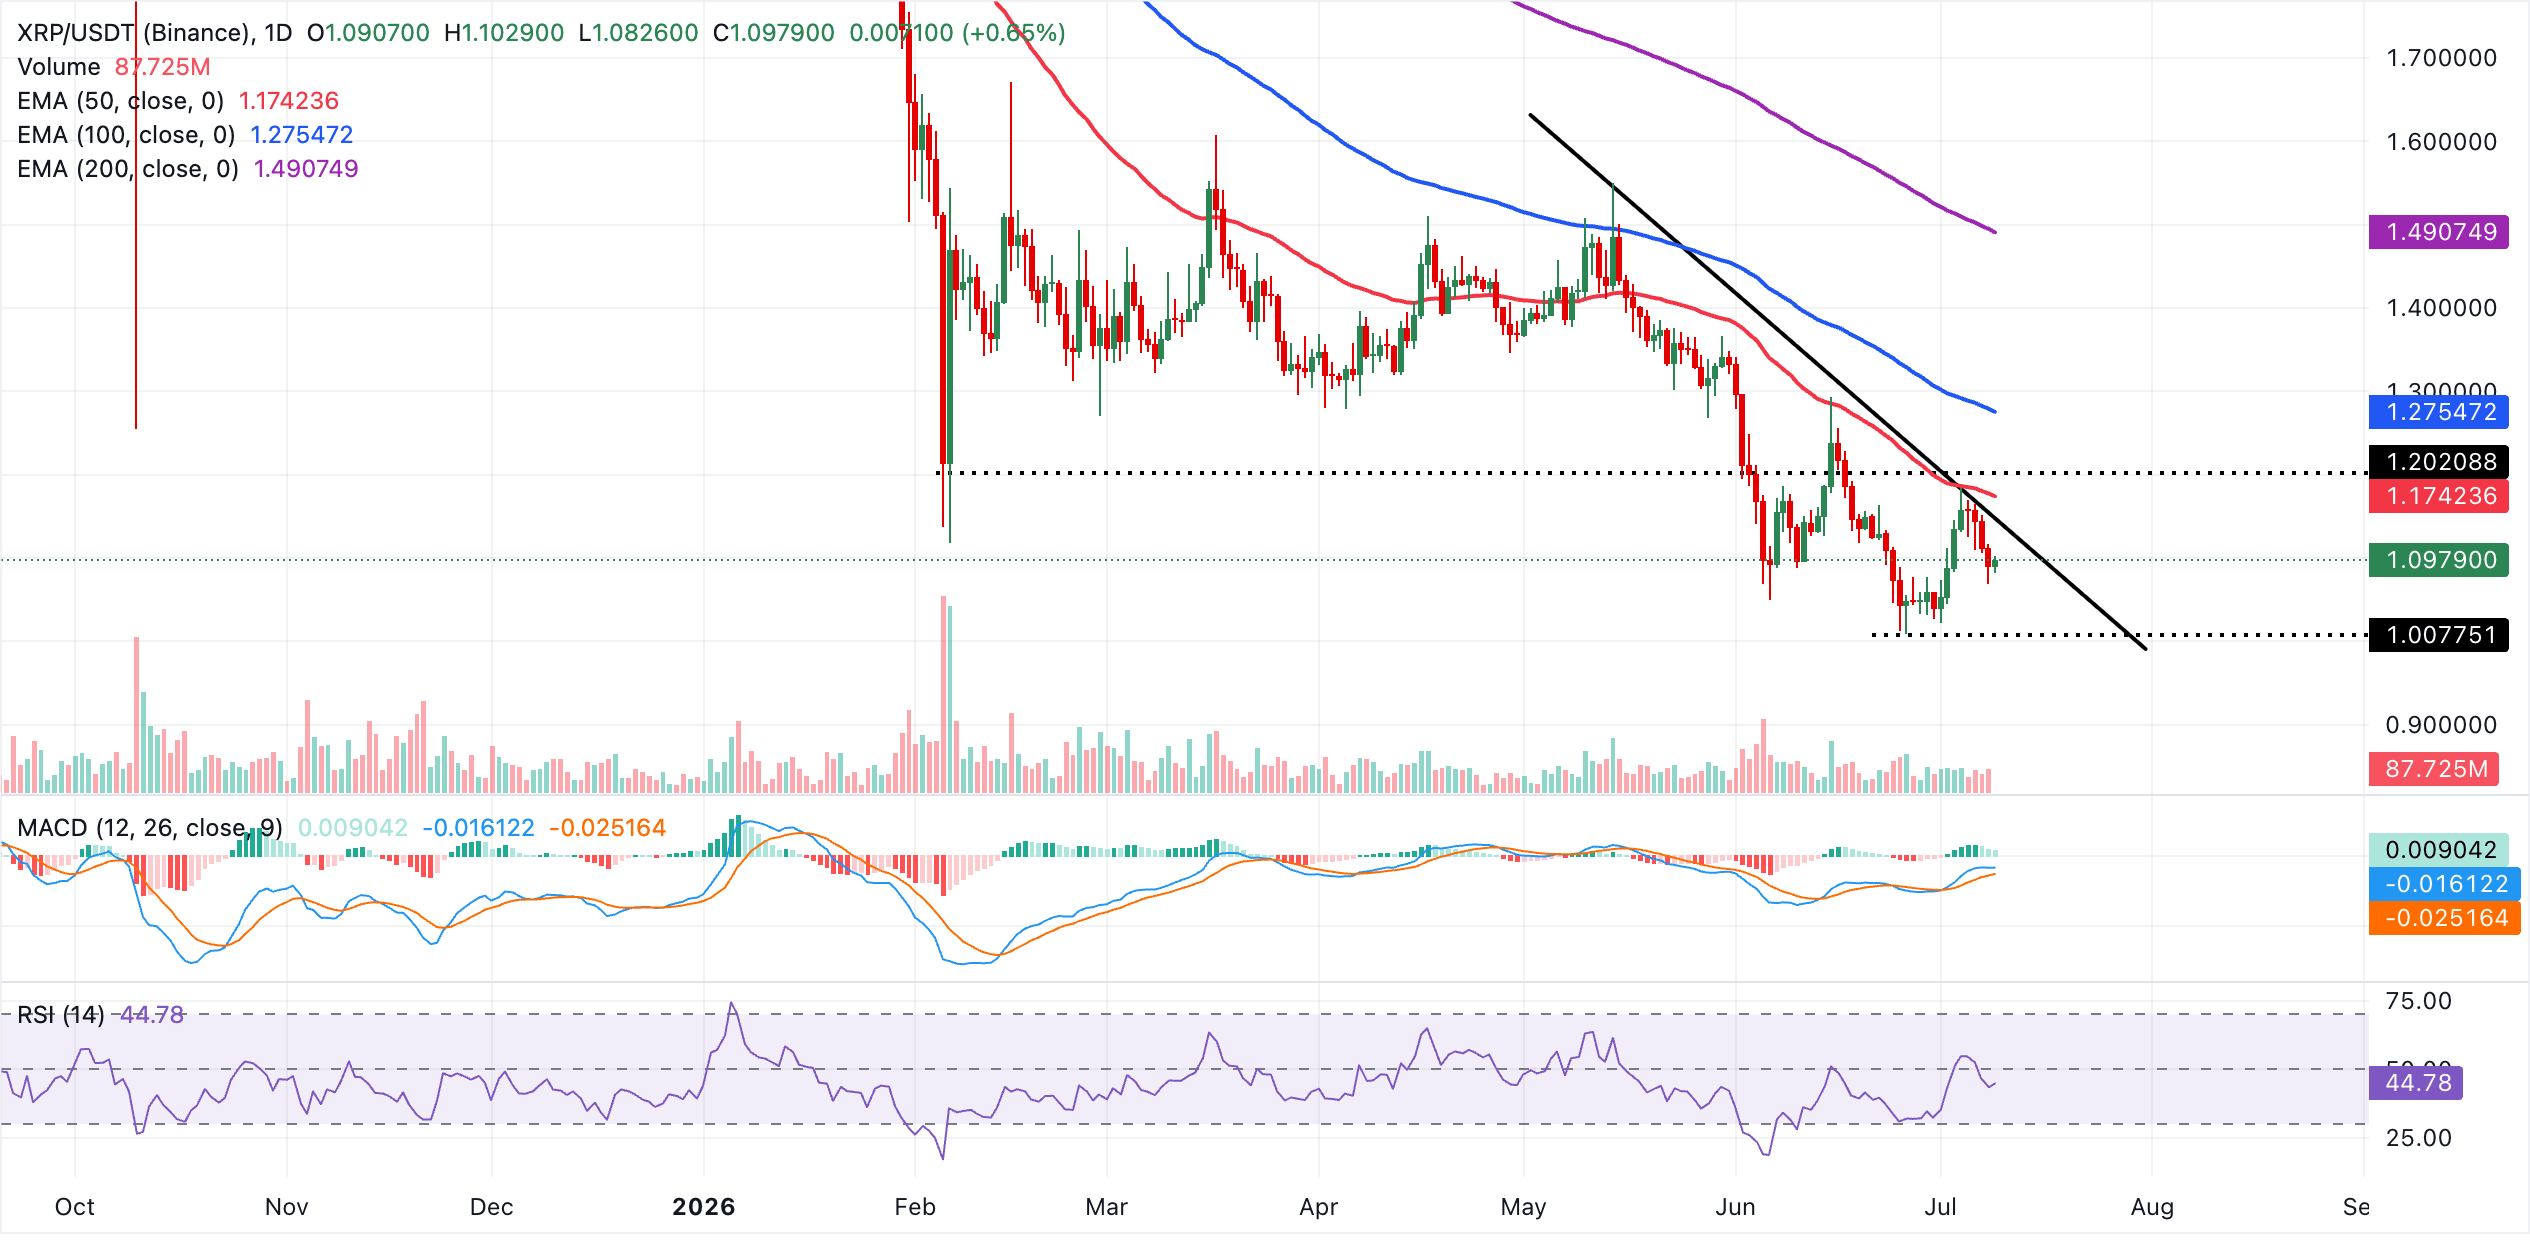
Initial resistance is seen at the descending trendline break level near $1.14, followed by the 50-day EMA at $1.17 as the next barrier. Above that, the 100-day EMA at $1.28 would be a stronger obstacle, while the 200-day EMA at $1.49 marks a major structural ceiling. With no clearly defined structural support levels on the daily chart, the pair remains vulnerable to further downside as long as it trades under this dense EMA stack. A key psychological area of interest for traders is the demand zone between $0.05 and $0.07.
(The technical analysis of this story was written with the help of an AI tool. Know more.)
Ripple FAQs
Ripple is a payments company that specializes in cross-border remittance. The company does this by leveraging blockchain technology. RippleNet is a network used for payments transfer created by Ripple Labs Inc. and is open to financial institutions worldwide. The company also leverages the XRP token.
XRP is the native token of the decentralized blockchain XRPLedger. The token is used by Ripple Labs to facilitate transactions on the XRPLedger, helping financial institutions transfer value in a borderless manner. XRP therefore facilitates trustless and instant payments on the XRPLedger chain, helping financial firms save on the cost of transacting worldwide.
XRPLedger is based on a distributed ledger technology and the blockchain using XRP to power transactions. The ledger is different from other blockchains as it has a built-in inflammatory protocol that helps fight spam and distributed denial-of-service (DDOS) attacks. The XRPL is maintained by a peer-to-peer network known as the global XRP Ledger community.
XRP uses the interledger standard. This is a blockchain protocol that aids payments across different networks. For instance, XRP’s blockchain can connect the ledgers of two or more banks. This effectively removes intermediaries and the need for centralization in the system. XRP acts as the native token of the XRPLedger blockchain engineered by Jed McCaleb, Arthur Britto and David Schwartz.
Author

John Isige
FXStreet
John Isige is a seasoned cryptocurrency journalist and markets analyst committed to delivering high-quality, actionable insights tailored to traders, investors, and crypto enthusiasts. He enjoys deep dives into emerging Web3 tren



