Arbitrum advances as Robinhood Chain fee-sharing boosts ecosystem and technical outlook
- Arbitrum gains over 7% on Thursday, erasing losses recorded earlier this week.
- Offchain Labs co-founder Steven Goldfeder announced that 10% of fees generated will flow back to the Arbitrum ecosystem.
- The technical outlook suggests further gains as momentum indicators show signs of improvement.

Arbitrum (ARB) trades above $0.081 on Thursday, erasing the losses recorded earlier this week. The price rally comes after an announcement by Steven Goldfeder, co-founder of Offchain Labs, that 10% of fees generated by Robinhood Chain and other Arbitrum Layer 2 (L2) will flow back to the ecosystem, boosting the Arbitrum long-term value. Meanwhile, a strengthening technical outlook supports further upside for ARB.
Robinhood Chain's fee-sharing with Arbitrum boosts sentiment
Arbitrum developer and Offchain Labs co-founder Steven Goldfeder said in an X post that 10% of fees collected on Robinhood Chain (and every other Arbitrum L2) go to the Arbitrum ecosystem, 8% to the tokenholder-controlled treasury, and 2% to fund development.
Goldfeder said, “As enterprise adoption is heating up, Arbitrum is well positioned to capture revenue. And of course, 100% of fees collected on Arbitrum One go to the Arbitrum treasury.”
This announcement is bullish for the Arbitrum ecosystem and its native token, ARB, in the long term, as it bolsters the Decentralized Autonomous Organization (DAO) treasury, supports network development and enhances utility. In the short term, the market reacted positively to this announcement, with ARB surging over 7% on Thursday.
Arbitrum Price Forecast: Bulls target levels above the $0.09 mark
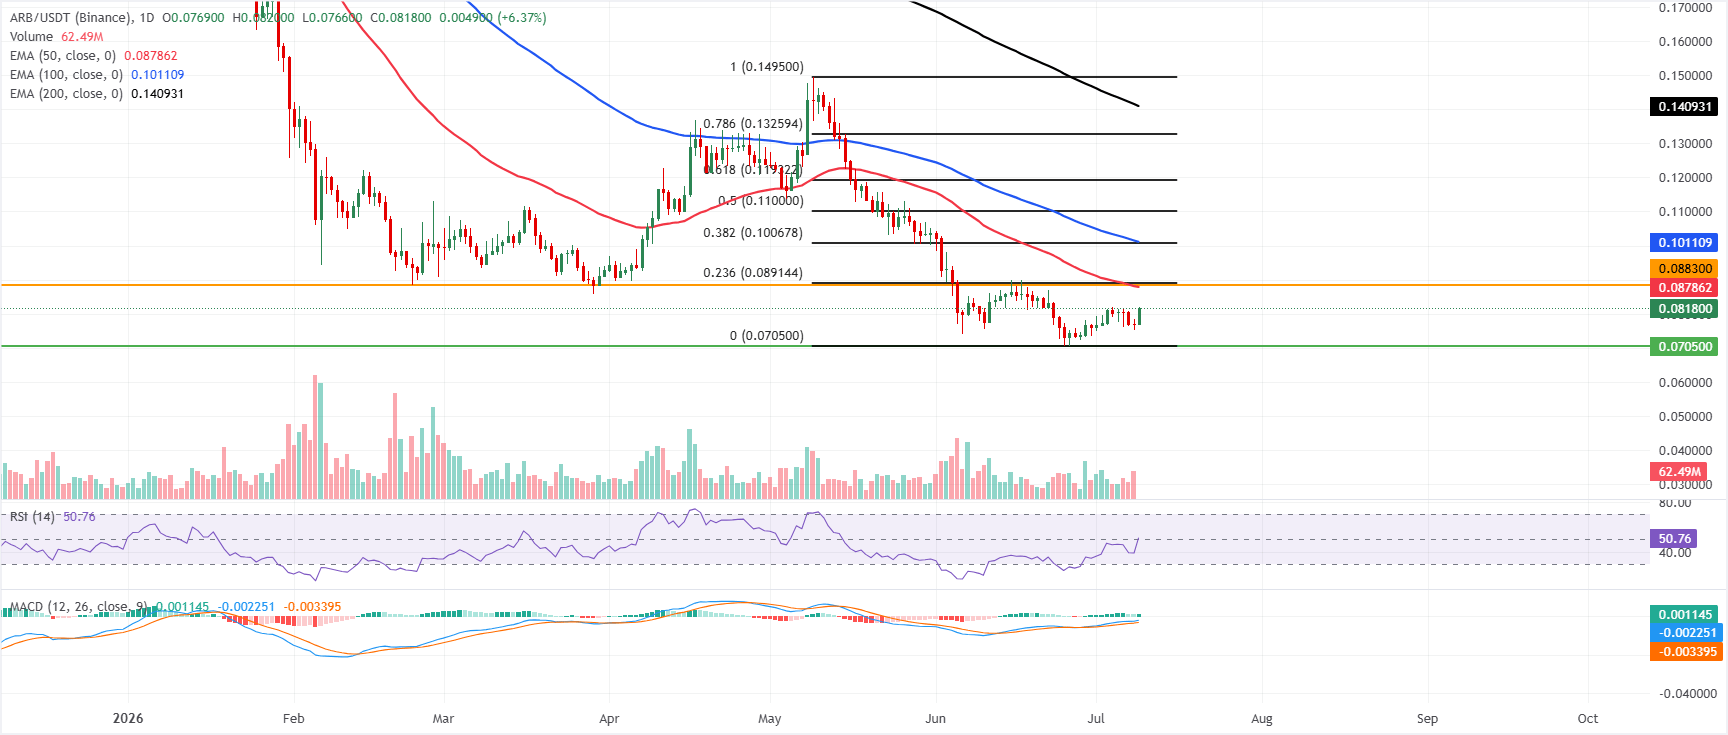
Arbitrum price trades above $0.0818 on Thursday, erasing the losses from the previous three days. Despite this surge, ARB maintains a cautious tone, holding below the key Exponential Moving Averages (EMAs). The broader downtrend is reinforced by the 200-day EMA at $0.1409, far above spot, while the Moving Average Convergence Divergence (MACD) and the Relative Strength Index (RSI) around 50 only hint at stabilizing momentum rather than a clear bullish shift.
On the topside, initial resistance is clustered between the 50-day EMA at $0.0878, the horizontal barrier at $0.0883 and the 23.6% Fibonacci retracement at $0.0891, with further hurdles at the 38.2% Fibonacci retracement at $0.1007 and the 100-day EMA at $0.1011.
On the downside, the main support sits at the prior swing low and the Fibonacci anchor near $0.0705, and a daily close below this floor would reopen the path toward fresh lows despite the recent improvement in momentum indicators.
(The technical analysis of this story was written with the help of an AI tool. Know more.)
Author

Manish Chhetri
FXStreet
Manish Chhetri is a crypto specialist with over four years of experience in the cryptocurrency industry.



