Ripple price analysis: XRP/USD holds above critical $0.30
- Ripple's coin has been moving in sync with the market.
- XRP/USD bulls need to clear $0.3230 to build upon the upside momentum.

Ripple's XRP hit the recent high at $0.3414 on July 20. The sell-off ensued that took the price towards the current levels marginally above the critical $0.3000. The third-largest digital coin with the current market capitalization of $13.1 billion has lost nearly 4% of its value on a day-on-day basis and stayed mostly unchanged since the beginning of Wednesday. The coin is moving within a short-term bearish trend amid the sell-off on the cryptocurrency market.
Read also:
Bank of America builds a settlement system based on Ripple's technology
Ripple adoption speeds up with South Korean Payment Remittance company, Sentbe
Ripple's technical picture
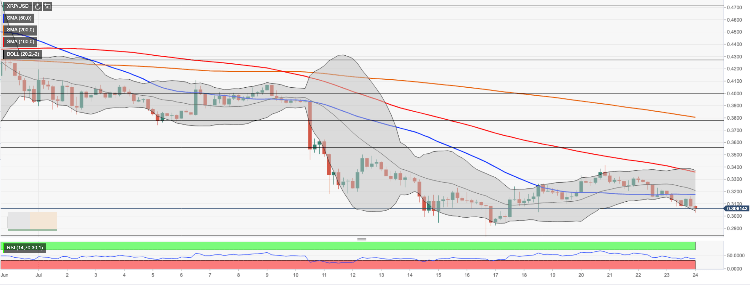
On the intraday charts, XRP/USD bulls have to take the price above $0.3175 to mitigate the initial bearish pressure. This barrier is created by a confluence of technical levels including SMA50 (Simple Moving Average) on 4-hour chart, SMA50 and SMA200 on 1-hour chart. Once it is out of the way, the upside may be extended towards $0.3230 (SMA100 1-hour) and psychological $0.33. This resistance is closely followed by $0.3370 (SMA100 4-hour and the lower line of 4-hour Bollinger Band)
On the downside, the initial support comes at $0.3040 (the lower line of 4-hour Bollinger Band), followed by the intraday low of $0.3026. Psychological $0.30 creates a strong barrier that is likely to stop the bears' push for a while. a sustainable move lower will trigger more sell-off towards the recent low of $0.2834.
Considering that the short-term RSI (the Relative Strength Index)stays flat close to oversold territory, we may suggest that the downside momentum will slow down at this stage.
XRP/USD, 4-hour chart
Author

Tanya Abrosimova
Independent Analyst


