Render could rally if it sustains an extended move above key resistance
- Render is attempting to break above a key rectangle channel's $5.155 resistance level.
- A successful move above this resistance could send Render toward the $6.097 level.
- A notable uptick in the 30-day MVRV could cause Render to witness high selling pressure.

Render is down 2% on Wednesday as it attempts to break above the $5.155 key resistance level. This move could trigger a rally and cause a notable uptick in average gains for investors who purchased it within the last 30 days.
Render attempts move above key resistance
Render fell below the $5.155 resistance level of a key rectangle channel on Wednesday after briefly moving above it earlier on Tuesday. In the past month, Render has sustained several sideways moves within this channel.
While the AI token is looking to retest the $5.155 resistance again, it's restricted by the 200-day Simple Moving Average (SMA). An extended move above the 200-day SMA could flip the $5.155 resistance into a support and stage a rally toward the $6.097 level. Conversely, if it sees another rejection around $5.155, it could decline toward the $4.274 support level.
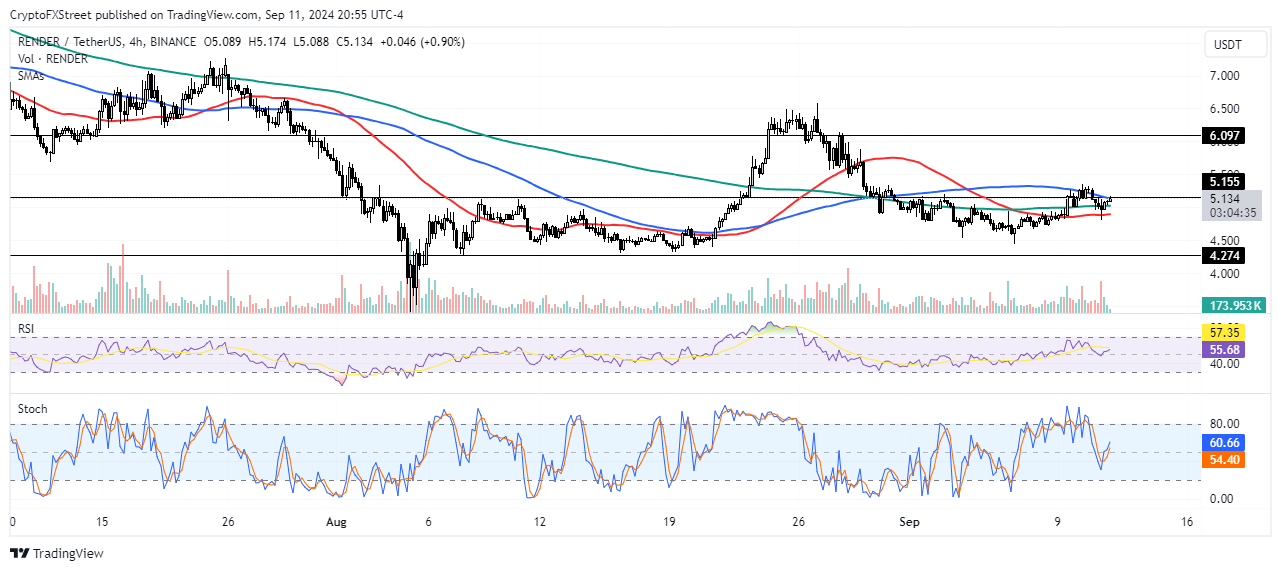
RENDER/USDT 4-hour chart
The Relative Strength Index (RSI) is at 52, just above the neutral level, indicating bullish momentum. The Stochastic Oscillator (Stoch) is below the neutral level at 47.
Render's Futures Open Interest (OI) has also been rising, increasing from $30.22 million on September 8 to $39.08 million on Wednesday. Open interest is the total number of unsettled long and short contracts within a derivatives market. The rising OI indicates that investors are increasingly placing bets on the price of Render. If prices are rising alongside it, the OI supports a bullish move.
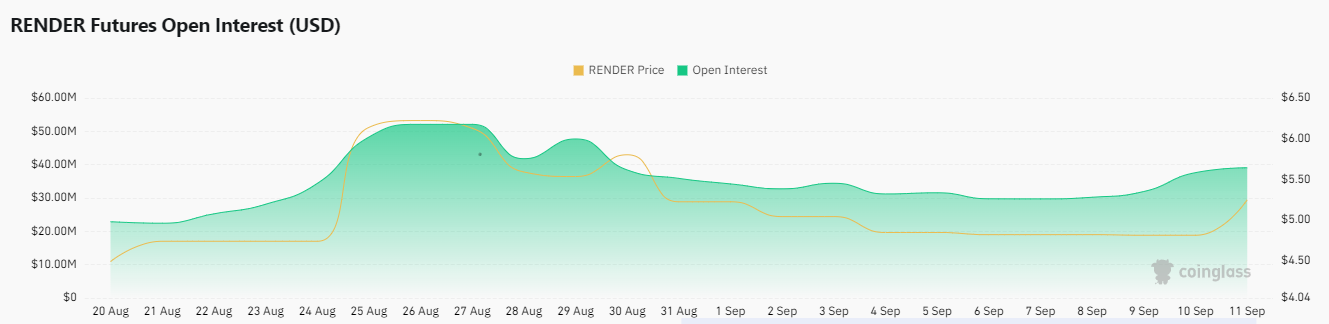
RENDER Open Interest
On the monthly time frame, Render is trading at a 9% gain. However, its 60-day, 90-day, 180-day and 365-day Market Value to Realized Value (MVRV) shows investors who bought Render in the past three months and upward are holding their tokens at an average loss, meaning they're less likely to sell at current prices.
The MVRV indicates the average profits or loss of all addresses that purchased a token within a specific time frame.
 [01.55.59, 12 Sep, 2024]-638617019145043729.png)
RENDER 30-day, 60-day, 90-day, 180-day, 365-day MVRV
Meanwhile, Render's 30-day MVRV ratio indicates that investors who bought in the past month are only seeing an average gain of 2%. Hence, this cohort of investors is less likely to cause any selling pressure currently with such a tiny profit margin. However, a rally toward $6.097 could cause massive profit-taking among this cohort and a subsequent price correction.
A daily candlestick close below $4.74 would invalidate the thesis.
Author

Michael Ebiekutan
FXStreet
With a deep passion for web3 technology, he's collaborated with industry-leading brands like Mara, ITAK, and FXStreet in delivering groundbreaking reports on web3's transformative potential across diverse sectors. In addition to


