Polygon price redistribution could lead to MATIC buying opportunities
- Polygon price shows signs of exhaustion after gains of 11% in the past week.
- A potential retracement to $0.599 seems likely as investors look to book profits.
- On-chain metrics show a clear redistribution among holders, adding credence to the short-term correction possibility.

Polygon (MATIC) price has rallied nearly 11% in under a week and encountered a key hurdle. A rejection here seems plausible, allowing sidelined buyers an opportunity to accumulate MATIC.
Also read: Bitcoin price likely to experience volatility if US NFP report for October exceeds expectations
MATIC price sets the stage for explosive growth
The daily candlestick closes of Polygon (MATIC) price has produced higher highs since October 24. However, the Relative Strength Index (RSI) has not confirmed this and has produced lower highs instead. This nonconformity, termed bearish divergence, signals a waning momentum. Hence, investors should expect the altcoin to correct. The fact that this sell signal has arrived as MATIC price retests the daily resistance level at $0.668 adds weight to the potential pullback.
Investors looking to accumulate MATIC tokens need to observe a retest of the $0.599, $0.580 and $0.562 support levels.
While the short-term outlook might seem bearish, this opportunity is likely to be followed by an explosive move to $0.668. Flipping this barrier would lead to a retest of the weekly resistance level of $0.739.
This move would constitute a 23% gain on the retest of $0.739.
In case MATIC price flips the $0.739 hurdle on a high time frame, it would be clear skies, allowing bulls to revisit the range high of $0.955.
Read more: MATIC price rally continues as Polygon’s POL contract goes live on Ethereum mainnet
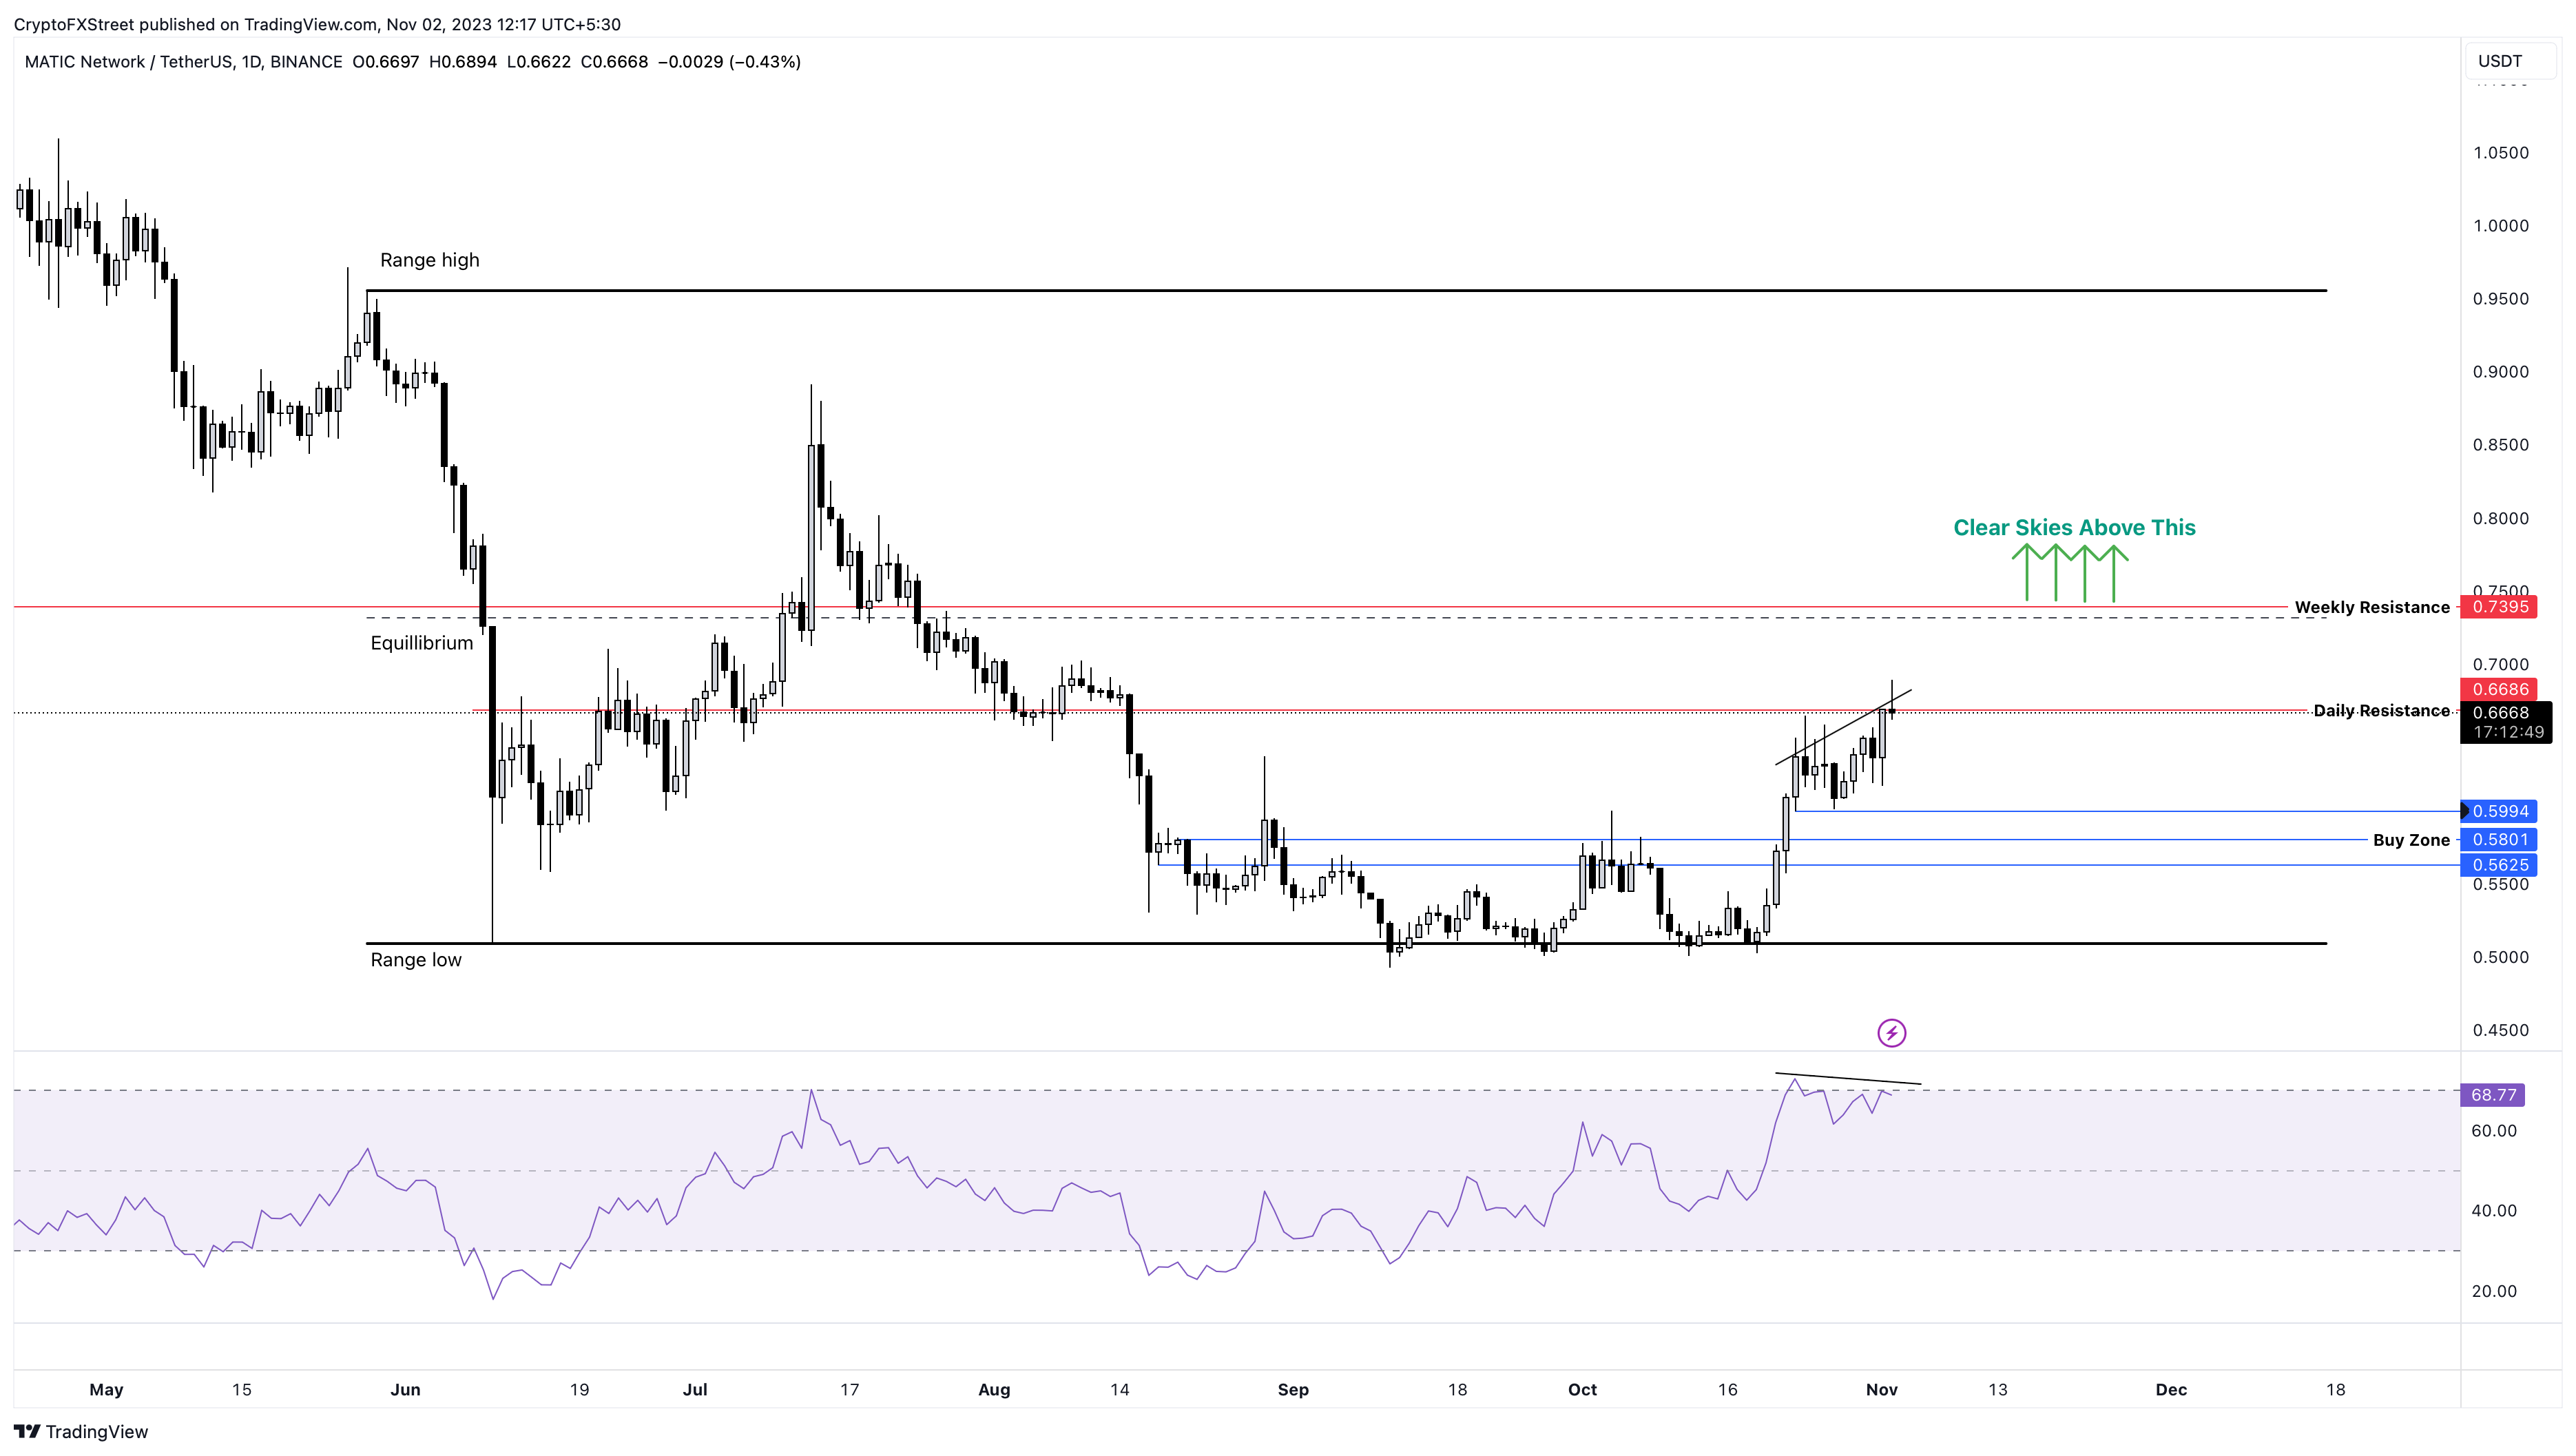
MATIC/USDT 1-day chart
Supporting the short-term correction for MATIC price is Santiment’s 90-day and 180-day Mean Dollar Invested Age (MDIA) metric. This indicator computes the average purchase price of tokens held in current addresses. A rising MDIA indicates a network-wide dormancy, which means investors are confident and are not looking to sell. On the other hand, a declining MDIA indicates redistribution effort, aka selling or profit-taking.
For Polygon, the 90-day and 180-day MDIA are both on the decline, suggesting a network-wide redistribution.
 [12.03.26, 02 Nov, 2023]-638345061064556533.png)
MATIC MDIA
Further adding credence to the idea of a short-term correction is the Whale Transaction metric, which tracks transfers worth $100,000 or more. A spike in this index after a rally suggests whales are moving their holdings to book profits. The recent spike in this indicator after an 11% rally denotes that a short-term correction is on its way.
 [12.03.21, 02 Nov, 2023]-638345061234724736.png)
MATIC Whale Transaction Count
While the short-term outlook is bearish for MATIC price, the long-term remains bullish. The $0.580 and $0.562 barriers kept the Layer 2 token compressed between August 17 to October 21. Hence, a daily candlestick close below $0.562 that flips it into a resistance level will invalidate the bullish scenario.
In such a case, investors can expect MATIC price to crash 9.50% and tag the range low at $0.508.
Author

Akash Girimath
FXStreet
Akash Girimath is a Mechanical Engineer interested in the chaos of the financial markets. Trying to make sense of this convoluted yet fascinating space, he switched his engineering job to become a crypto reporter and analyst.


