Polkadot price risks a 5% fall as DOT fills up a triangle
- Polkadot price has been on a downtrend since December 26, facing a strong rejection but the 50-day SMA provided buoyance.
- Nevertheless, DOT could fall 5% to the supply zone mean threshold at $6.9510, below which downtrend confirmation will manifest.
- The bearish thesis will be invalidated upon a daily candlestick close above the 78.60% Fibonacci level at $8.2960.

Polkadot (DOT) price has been on a downtrend, with its upside potential capped by a descending trendline. To the south, DOT stays buoyant thanks to the support offered by the 50-day Exponential Moving Average (EMA) at $7.3100, reinforced by the ascending triangle that completes the triangle.
Also Read: Polkadot Price Prediction: DOT could continue the uptrend, rise 30% if these conditions are met
Polkadot price fills up a triangle
Polkadot (DOT) price action is filling up a triangle as it consolidates below a descending trendline while maintaining above an ascending trendline. The odds favor the downside as the Relative Strength Index (RSI) is dropping to show falling momentum.
In the same way, the Moving Average Convergence Divergence (MACD) indicator is moving south after crossing below the signal line (orange band) during late December.
Increased selling pressure could see Polkadot price lose the support offered by the 50-day EMA at $7.3100, which is almost at the confluence with the most important Fibonacci level, 61.8%, at $7.2860.
An extended fall could see the DOT price fall 5% into the demand zone, stretching between $6.7800 and $7.1220. A break and close below is midline at $6.9510 would confirm the continuation of the downtrend.
In the dire case, Polkadot price could slip below the demand zone, to tag the 50% Fibonacci level at $6.5760, below which the big picture bullish outlook would be invalidated. The next logical target for DOT in such a scenario would be the 100-day SMA at $5.9720, or worse, the 38.2% Fibonacci level at $5.8670. Such a move would denote a 20% fall below current levels.
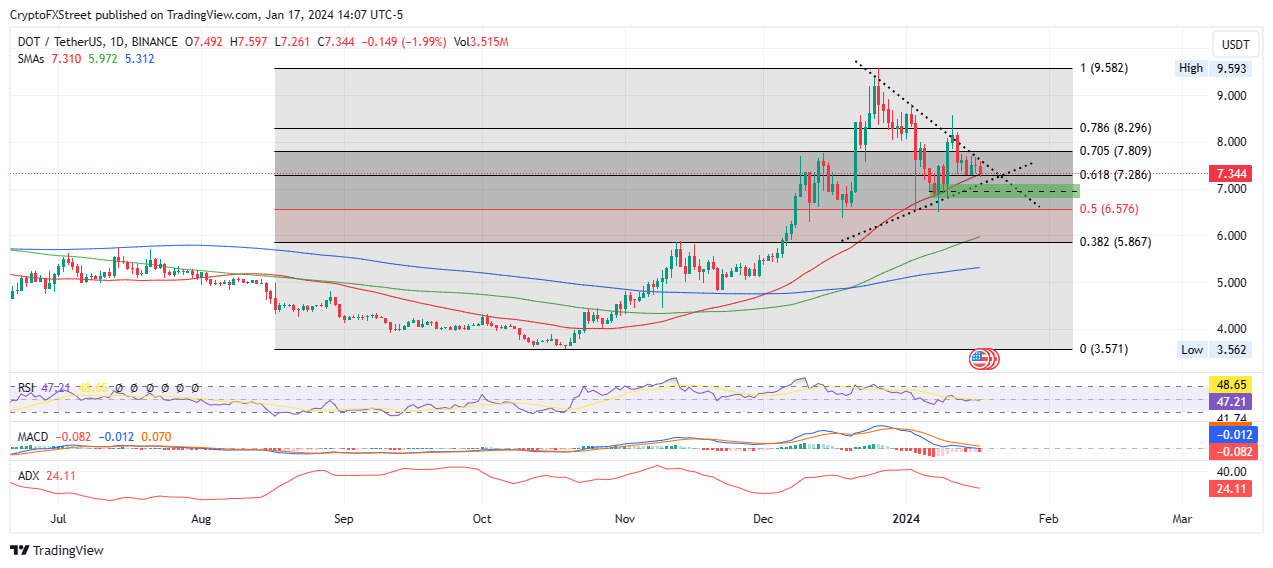
DOT/USDT 1-day chart
On-chain metrics supporting Polkadot price bearish outlook
Santiment data shows falling social volume and social dominance, pointing to reduced mentions of the DOT coin across crypto-related social media.
 [01.32.10, 18 Jan, 2024]-638411276818526819.png)
DOT Social Volume, Social Dominance
Development activity has also dropped from 77 to 71 between January 11 and January 18, representing a 7.7% drop in a week, with the buying power of the whales still low. This is seen in the drop in the percentage of stablecoin total supply held by whales with more than $5 million. Specifically, this metric has dropped to 50.62, relative to the 51.09 highs of December.
 [01.42.18, 18 Jan, 2024]-638411281596282099.png)
DOT Development Activity, Percentage of stablecoin total supply held by whales
On the other hand, if buying pressure increases, Polkadot price could shatter past the falling trendline of the triangle to tag the 70.5% Fibonacci level at $7.8090. Further north, the gains could see DOT market value hit the 78.6% Fibonacci level at $8.2960, with a break and close above it invalidating the bearish thesis.
This would set the pace for a continuation of the trend, with Polkadot price likely to climb to fill the market range at $9.5820, levels last tested on December 26.
Author

Lockridge Okoth
FXStreet
Lockridge is a believer in the transformative power of crypto and the blockchain industry.


