Polkadot bulls pour in and rally DOT higher
- Polkadot price up more than 22% from the December 20 low.
- Near-term resistance ahead near the $31 value area.
- Insanely bullish reversal pattern now present on the Point and Figure Chart

Polkadot price could experience an unprecedented spike over the next week and extend into late January 2022. The setup on the $2.00/3-box reversal Point and Figure chart indicates a more than 300% move higher from the present value area.
Polkadot price poised to move to $82
Polkadot price has a strong bullish reversal Point and Figure chart pattern developing. That pattern is known as a Spike Pattern. A Spike Pattern is any columns of Xs or Os with fifteen or more boxes.
Polkadot completed the Spike Pattern when it hit its most recent swing low near the $24 value area. The entry off of a Spike Pattern is always the three-box reversal. This gives bulls an outstanding opportunity to enter at the bottom of a swing.
The hypothetical long setup off the Spike Pattern is a buy stop order at the 3-box reversal (currently $32), a stop loss of 4-boxes (currently at $24), and a profit target at $82. The profit target is derived from the Vertal Profit Target Method in Point and Figure Analysis.
The long trade idea provides a 6.25:1 reward for the risk trade setup. In addition, a two to three-box trailing stop would help protect any implied profits post entry.
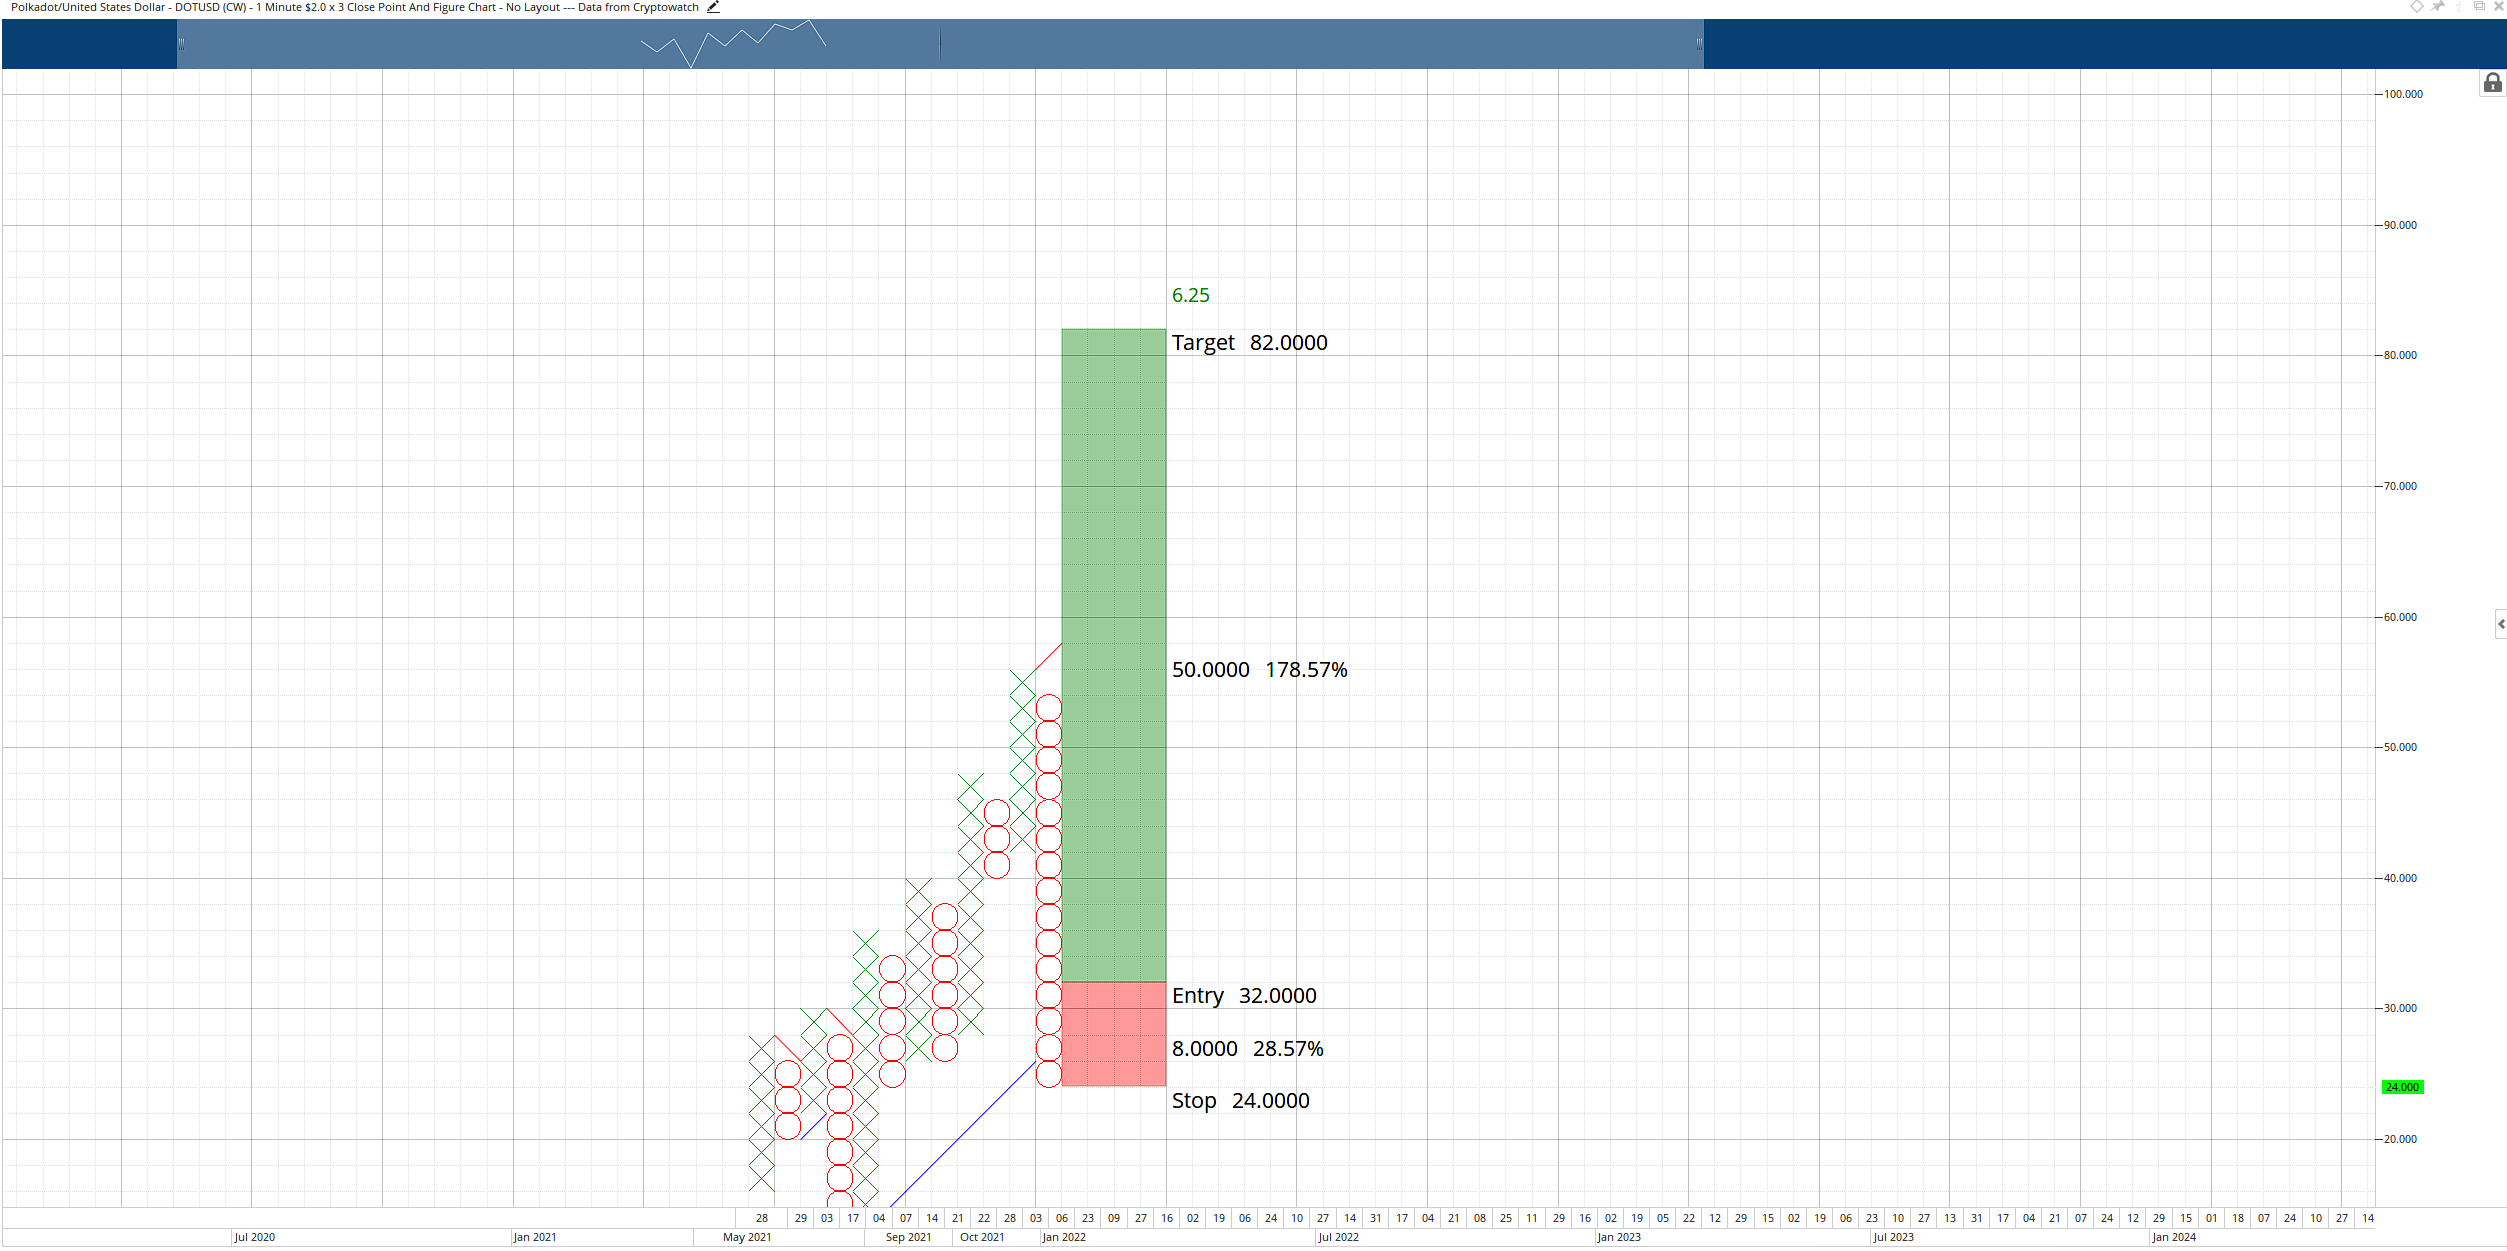
DOT/USDT $2.00/3-box Reversal Point and Figure Chart
There is no current invalidation point for the entry because as Polkadot price moves lower, so does the entry.
Traders should watch the daily Ichimoku chart near the entry level at $32. There is considerable resistance at $31 to $32, and it is very likely buyers may have a tough time moving above that price range on the first test.
Author

Jonathan Morgan
Independent Analyst
Jonathan has been working as an Independent future, forex, and cryptocurrency trader and analyst for 8 years. He also has been writing for the past 5 years.


