Pi Network rebounds as whale interest signals potential recovery
- Pi Network ticks higher by over 2% on Tuesday after four consecutive days of losses.
- A surge in large-wallet investors' interest in Pi Network’s spot market signals upside potential.
- The technical outlook for PI remains mixed, as the MACD indicator flashes a sell signal while the RSI hovers near the midline.

Pi Network (PI) ticks higher by 2% at press time on Tuesday, after a steady decline over four consecutive days, marking a downcycle within a larger consolidation range. However, a persistent demand from large-wallet investors, popularly known as whales, flags the range as a potential accumulation zone, suggesting an upside breakout.
Although the whales remain interested, the technical outlook for PI remains mixed, with momentum indicators flashing neutral to bearish signals.
Persistent whale interest signals potential recovery
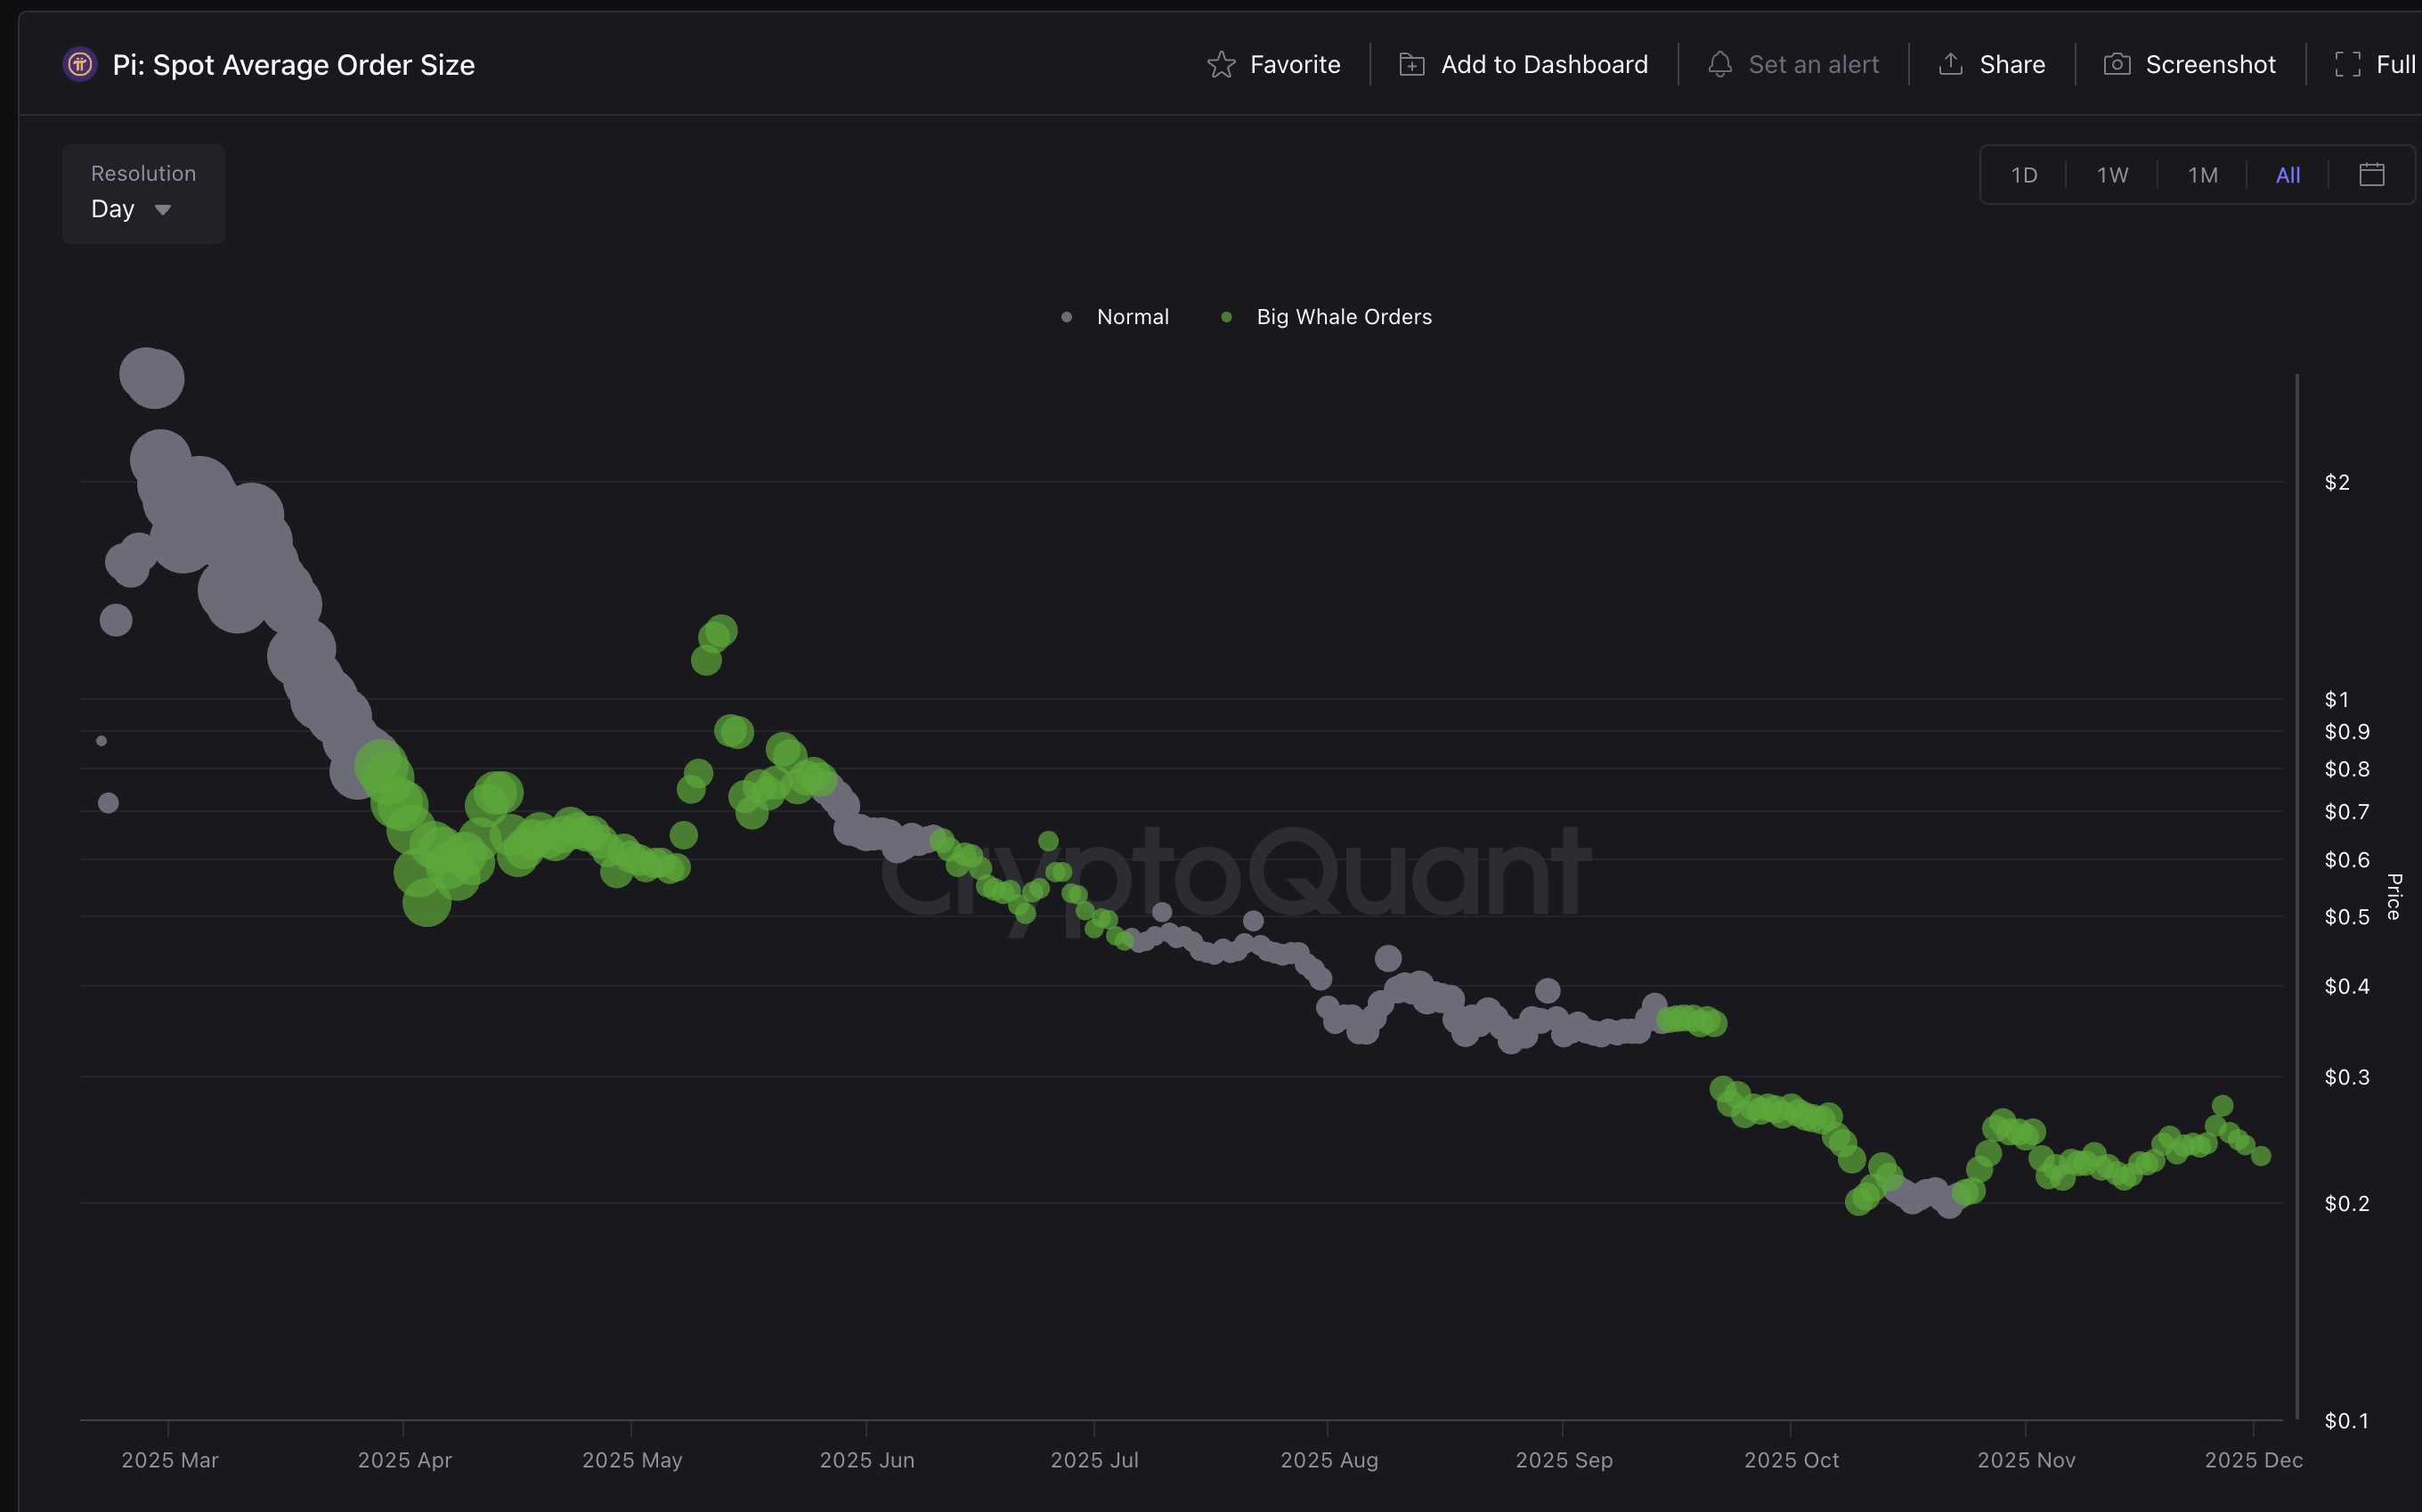
A steady interest from whales in a cryptocurrency during the consolidation phase is typically associated with an accumulation zone, which could foreshadow a recovery run. CryptoQuant’s data shows an increase in whale activity in the PI spot market, boosting the average order size.
Historically, a similar accumulation phase in April led to the sharp recovery seen in early May.
Technical outlook: Will Pi Network’s recovery break out of the consolidation range?
Pi Network trades below the 50-day Exponential Moving Average (EMA) at press time on Tuesday. The PI token’s intraday recovery triggers an abrupt end to its bearish trend from the $0.2860 upper resistance of a consolidation range, with the lower support at $0.1919, marked by the September 23 high and October 11 low, respectively.
A decisive close above $0.2860 would confirm a bullish breakout of the consolidation range. On the upside, the PI token could face resistance at $0.3220 and $0.3987, corresponding to the low of August 1 and the high of August 30, respectively.
However, the momentum indicators on the daily chart signal underlying weakness in the trend, as the Moving Average Convergence Divergence (MACD) crossed below its red line on Monday, signaling a bearish shift and a sell signal.
Still, the Relative Strength Index (RSI) is at 47, rising toward the halfway line after a steep correction during the four-day correction period, fluctuating near the neutral levels.
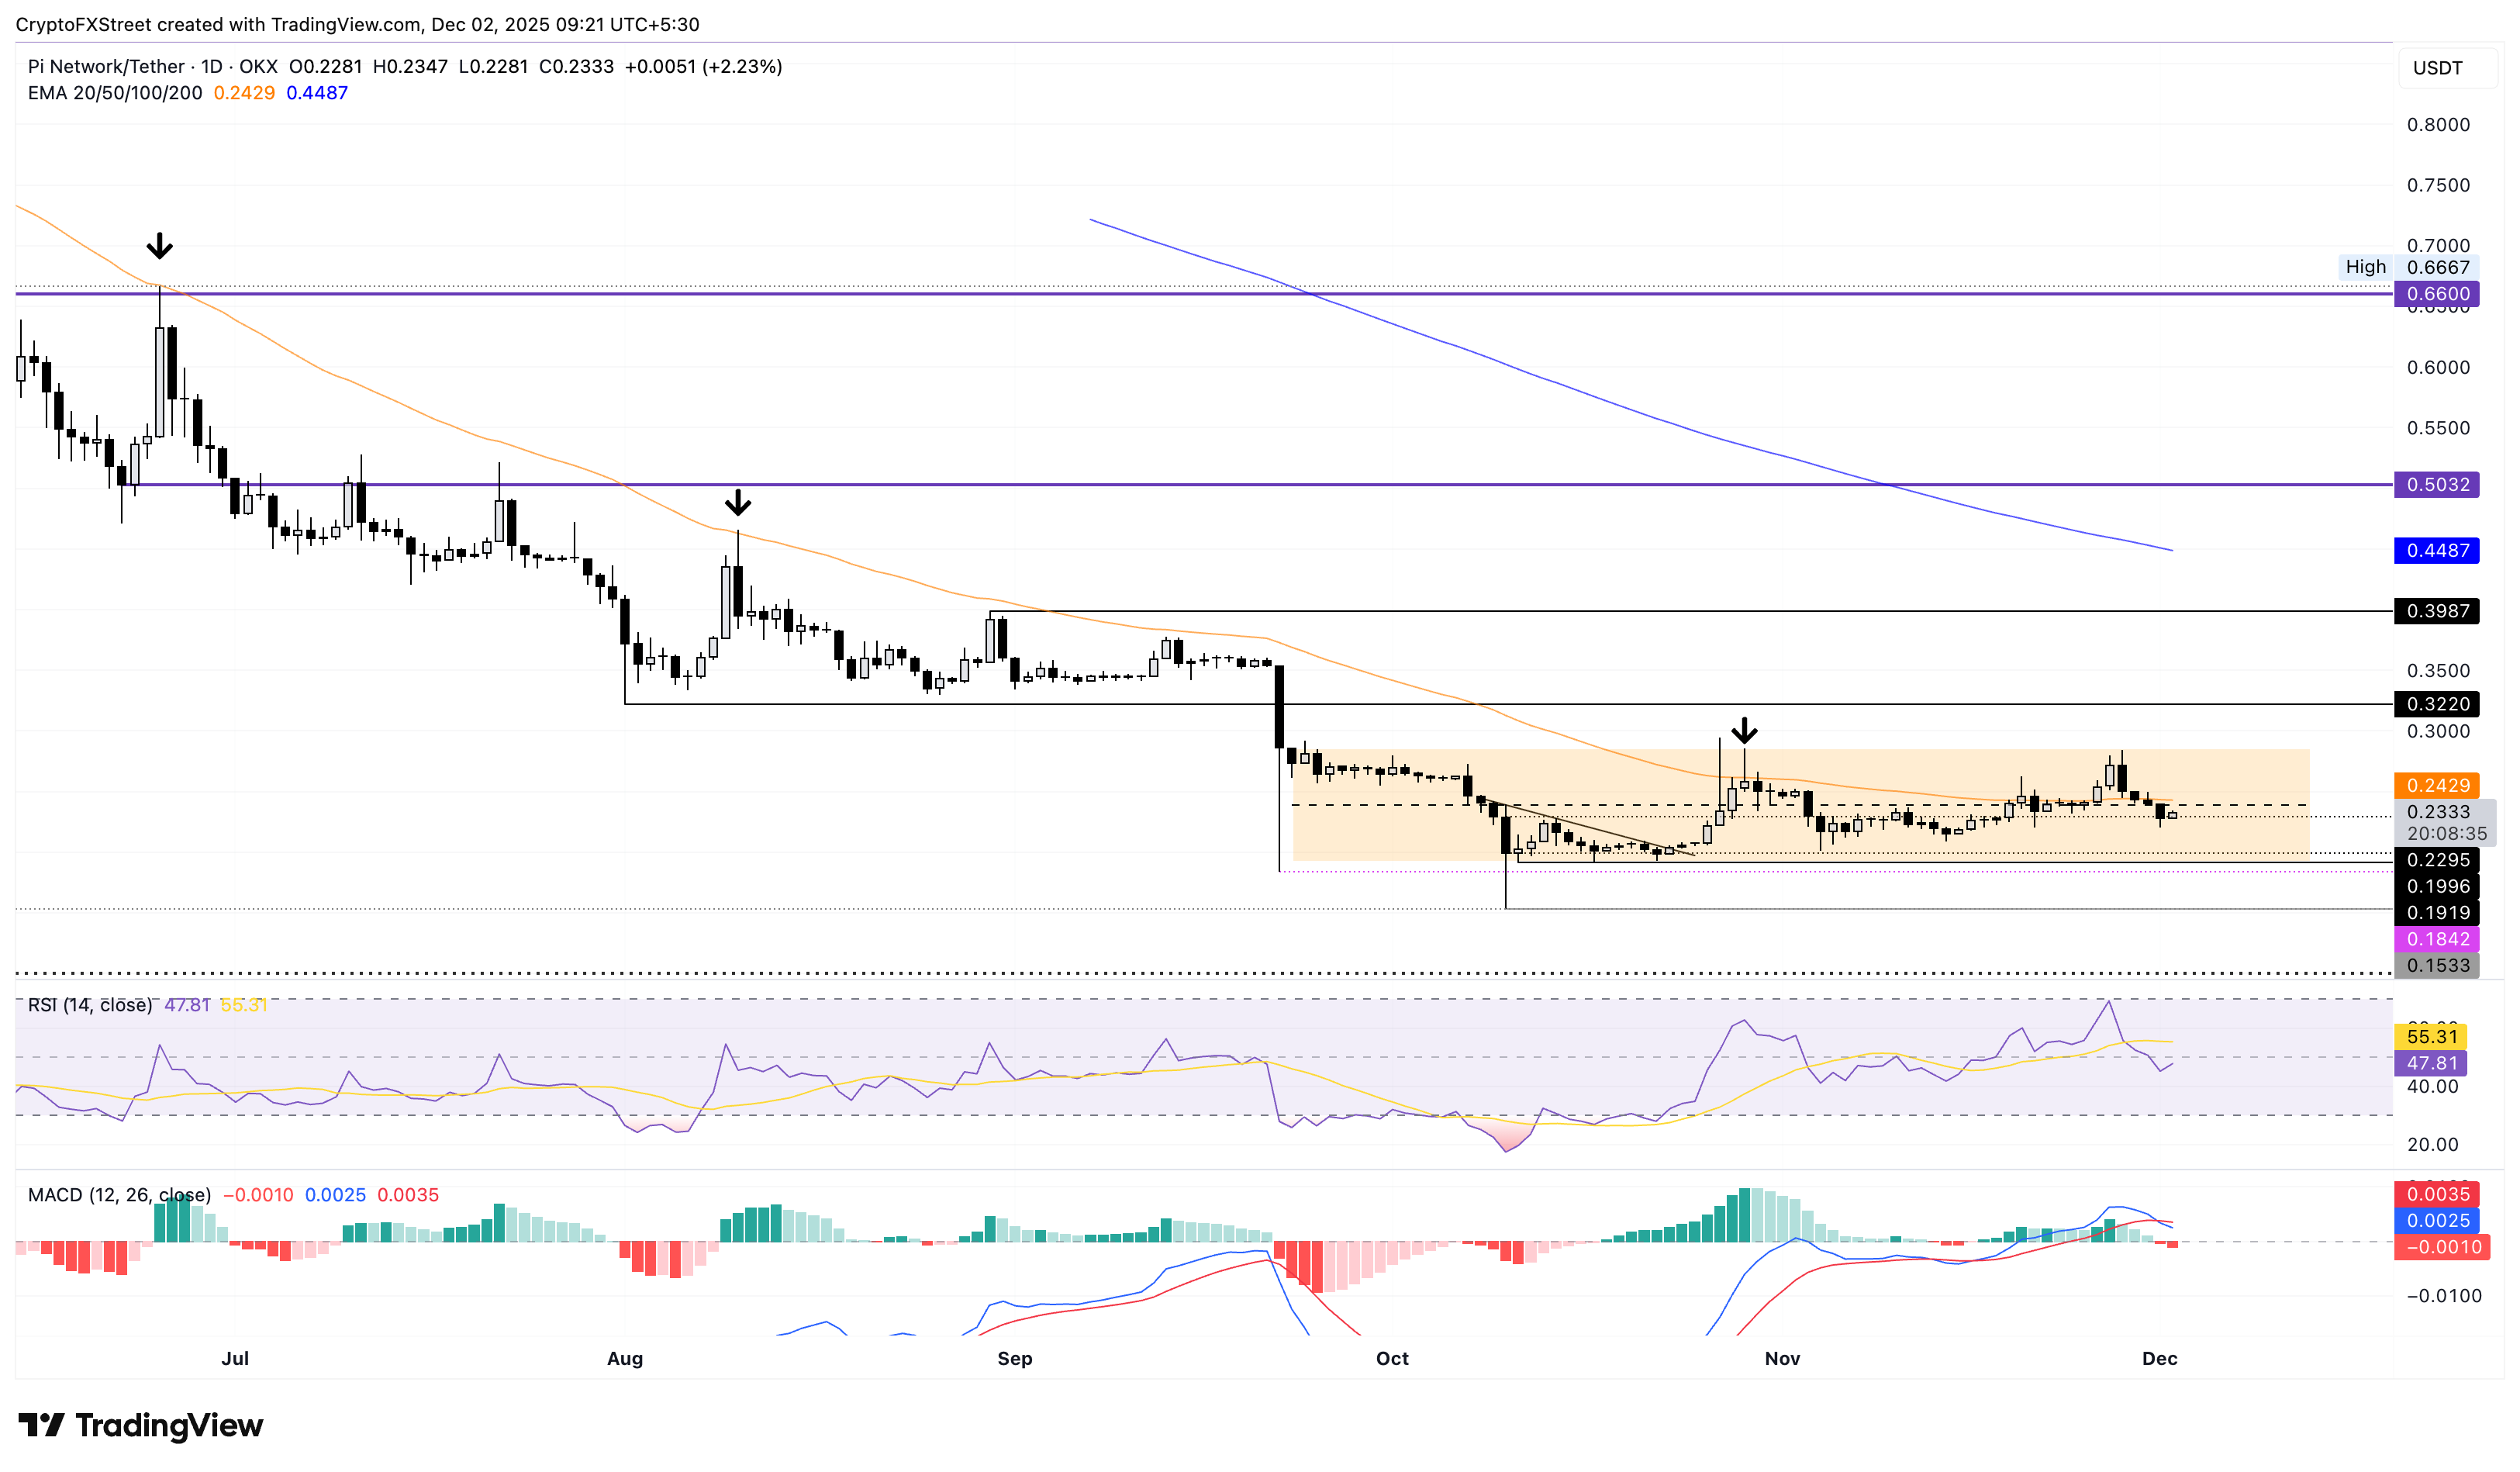
On the downside, key support for PI remains at the $0.2000 psychological level and the October 11 low at $0.1919.
Cryptocurrency prices FAQs
Token launches influence demand and adoption among market participants. Listings on crypto exchanges deepen the liquidity for an asset and add new participants to an asset’s network. This is typically bullish for a digital asset.
A hack is an event in which an attacker captures a large volume of the asset from a DeFi bridge or hot wallet of an exchange or any other crypto platform via exploits, bugs or other methods. The exploiter then transfers these tokens out of the exchange platforms to ultimately sell or swap the assets for other cryptocurrencies or stablecoins. Such events often involve an en masse panic triggering a sell-off in the affected assets.
Macroeconomic events like the US Federal Reserve’s decision on interest rates influence crypto assets mainly through the direct impact they have on the US Dollar. An increase in interest rate typically negatively influences Bitcoin and altcoin prices, and vice versa. If the US Dollar index declines, risk assets and associated leverage for trading gets cheaper, in turn driving crypto prices higher.
Halvings are typically considered bullish events as they slash the block reward in half for miners, constricting the supply of the asset. At consistent demand if the supply reduces, the asset’s price climbs.
Author

Vishal Dixit
FXStreet
Vishal Dixit holds a B.Sc. in Chemistry from Wilson College but found his true calling in the world of crypto.



