Pi Network Price Forecast: Large deposits on CEXs fuel bearish trend
- Pi Network’s PI token edges lower to its record low of $0.3220 within a falling channel pattern.
- Rising CEXs' wallet balances indicate large PI deposits as risk-off sentiment intensifies.
- The technical outlook remains bearish, suggesting a potential new record low.
Pi Network (PI) recovers by 1% so far on Wednesday, following two consecutive days of losses that accounted for nearly 10%. The declining PI token price trend within a falling channel pattern risks further losses to a potentially new record low as large deposits to centralized exchanges (CEXs) boost selling pressure.
Large deposits to CEXs signal increased selling pressure
PiScan data shows that the 7.06 million PI token inflows to the CEXs' wallet balances outpaced the 3.94 million PI outflow, resulting in a net inflow of 3.11 million PI tokens, which is worth nearly $1.08 million at the current price. The 3.11 million net PI token inflow results in a 0.75% increase in the CEXs' wallet balances, rising to 414.63 million PI tokens.
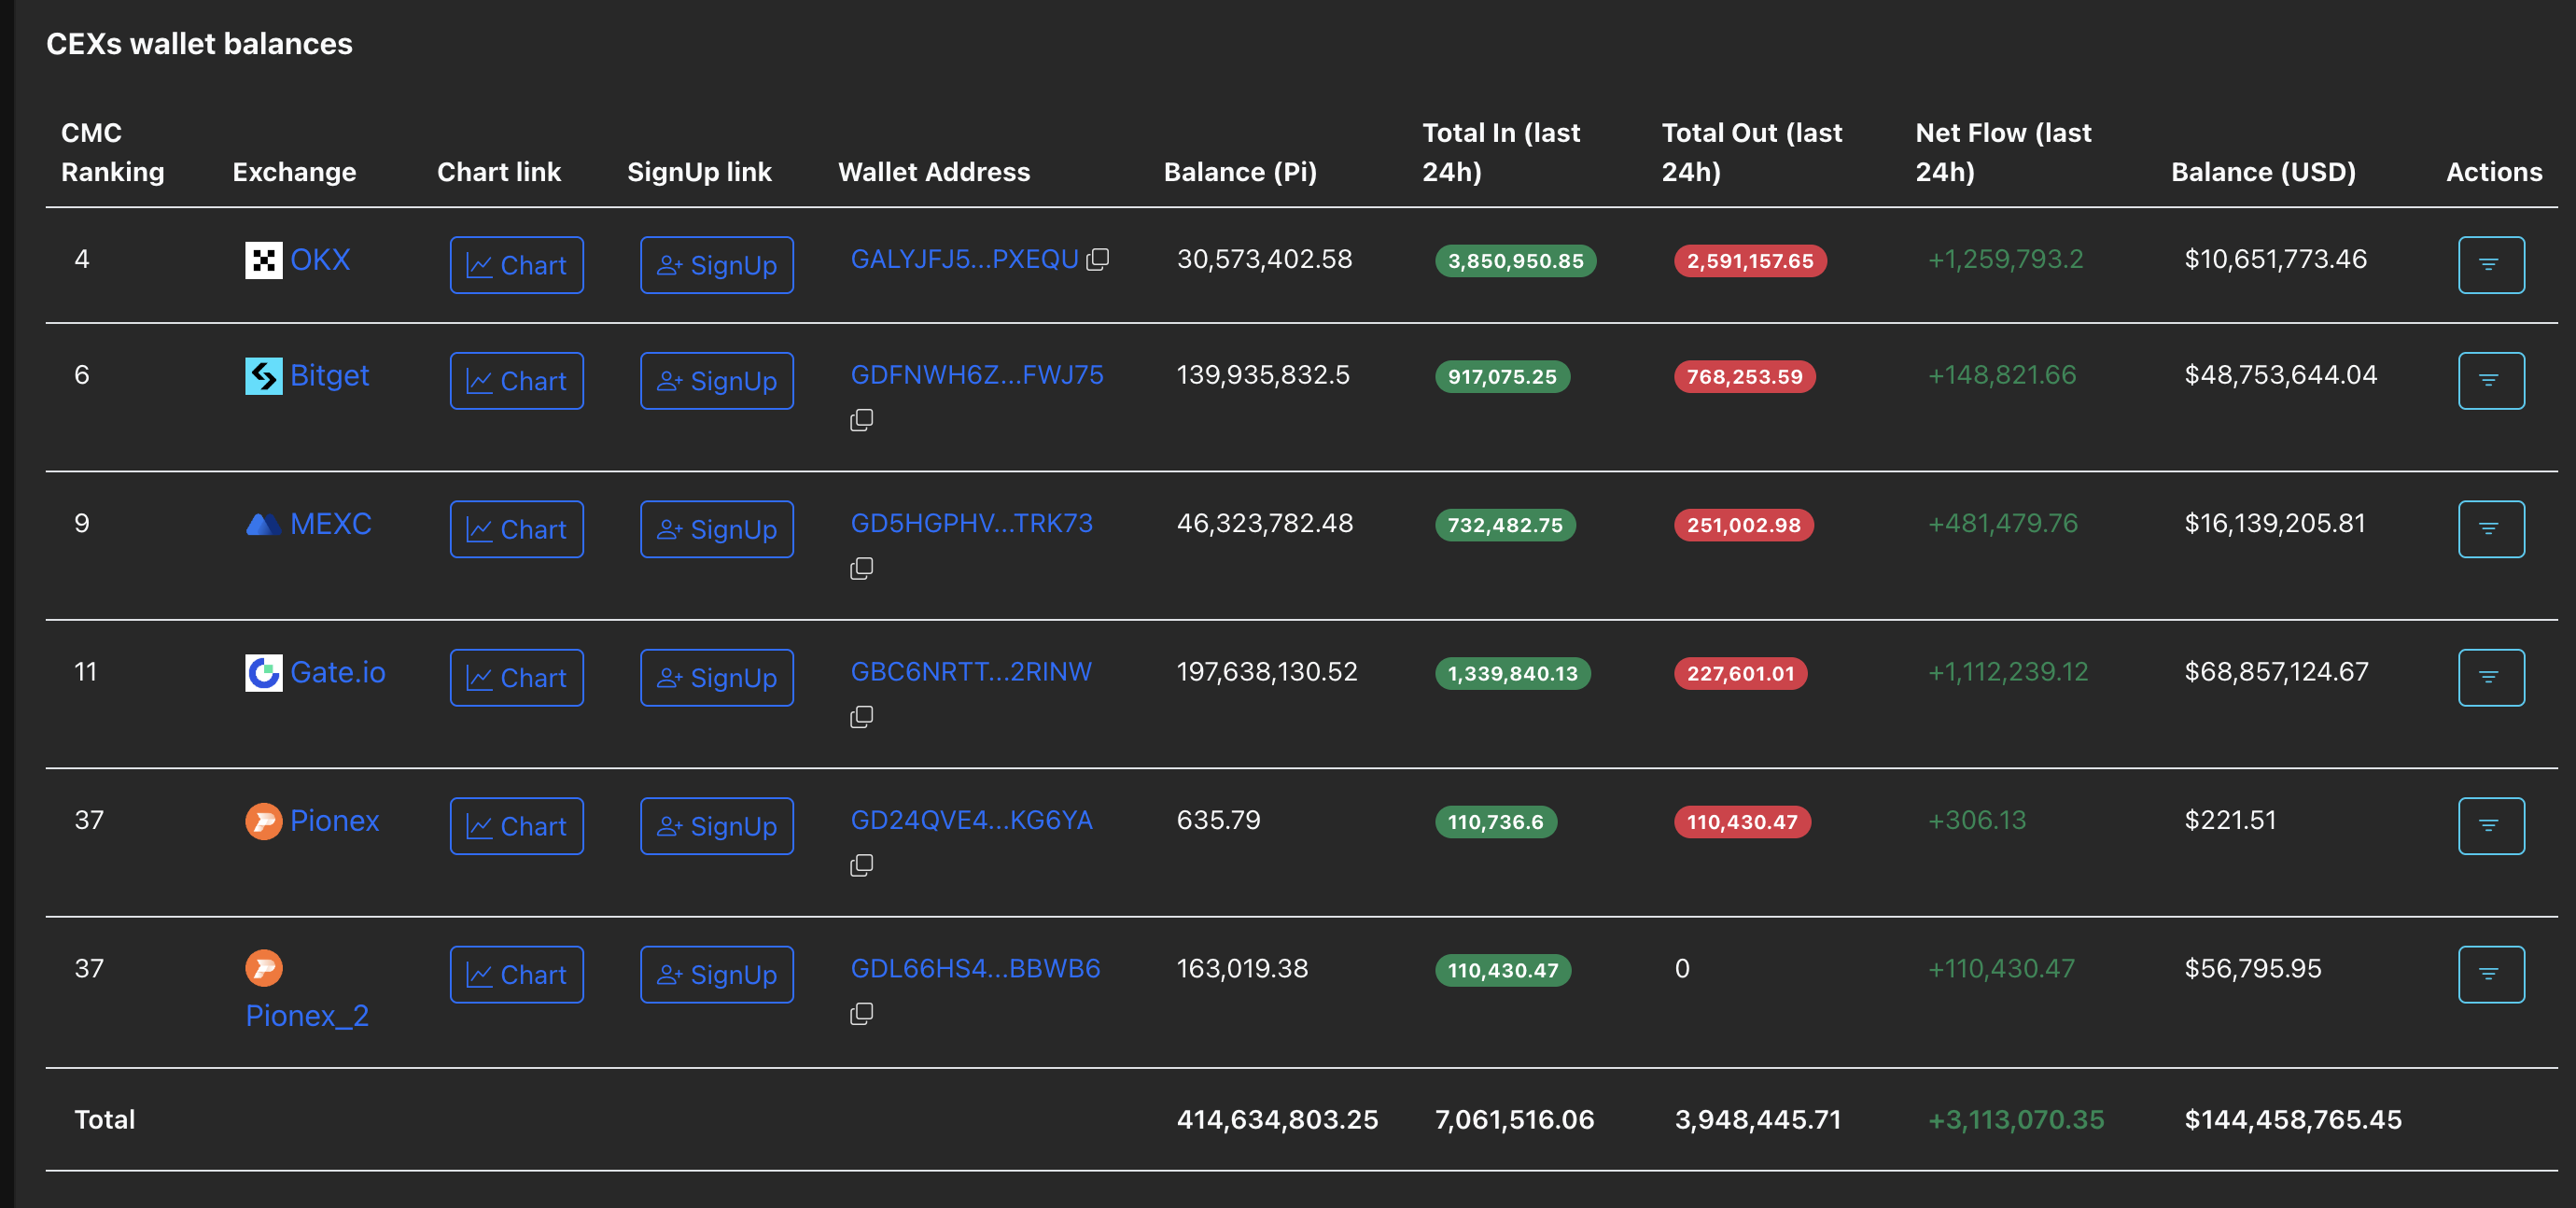
CEXs Wallet Balances. Source: Coinglass
It is worth noting that two out of the three largest transactions on the Pi Network over the last 24 hours are large deposits to the OKX exchange. The transactions refer to 1.24 million and 809,684 PI tokens. Typically, an increase in exchange reserves driven by large deposits signals a risk-off sentiment among investors, fueling the correction phase.
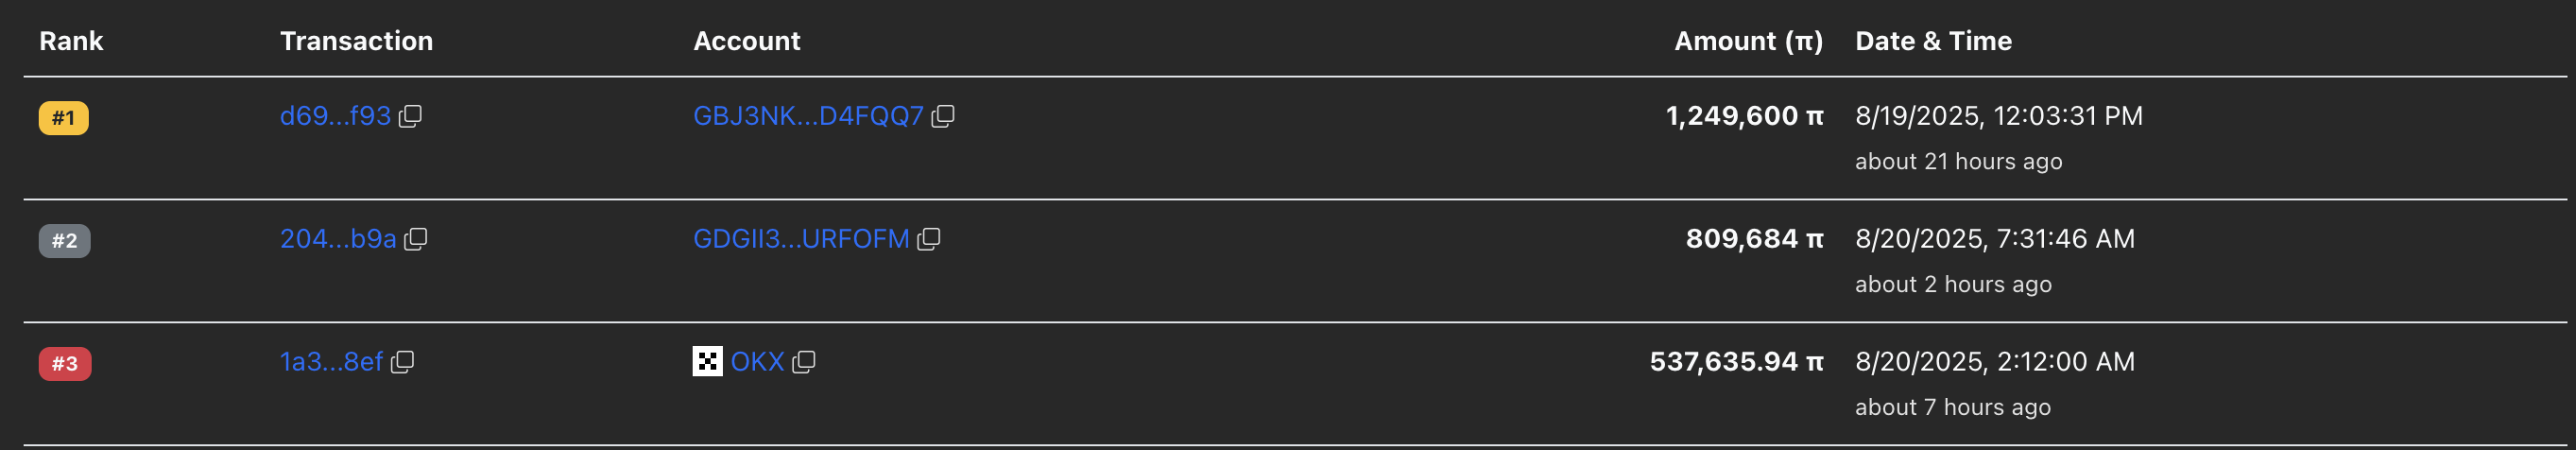
Large transactions. Source: Coinglass
Pi Network risks further losses in a falling channel
PI trades at $0.3481 at press time on Wednesday, with bulls attempting to halt the third consecutive bearish candle on the daily chart. Still, price action on the same chart highlights a pullback phase in a falling channel pattern, with bears targeting $0.3220, the all-time low recorded on August 1.
A decisive push below this level could retest the falling channel’s lower boundary level near $0.2700 for a fresh record low.
The Relative Strength Index (RSI) reads 42 on the daily chart as it hovers above the oversold boundary line. This suggests a bearish momentum, with further room for correction.
The Moving Average Convergence Divergence (MACD) crosses below its signal line, signalling a bearish turnaround in trend momentum.
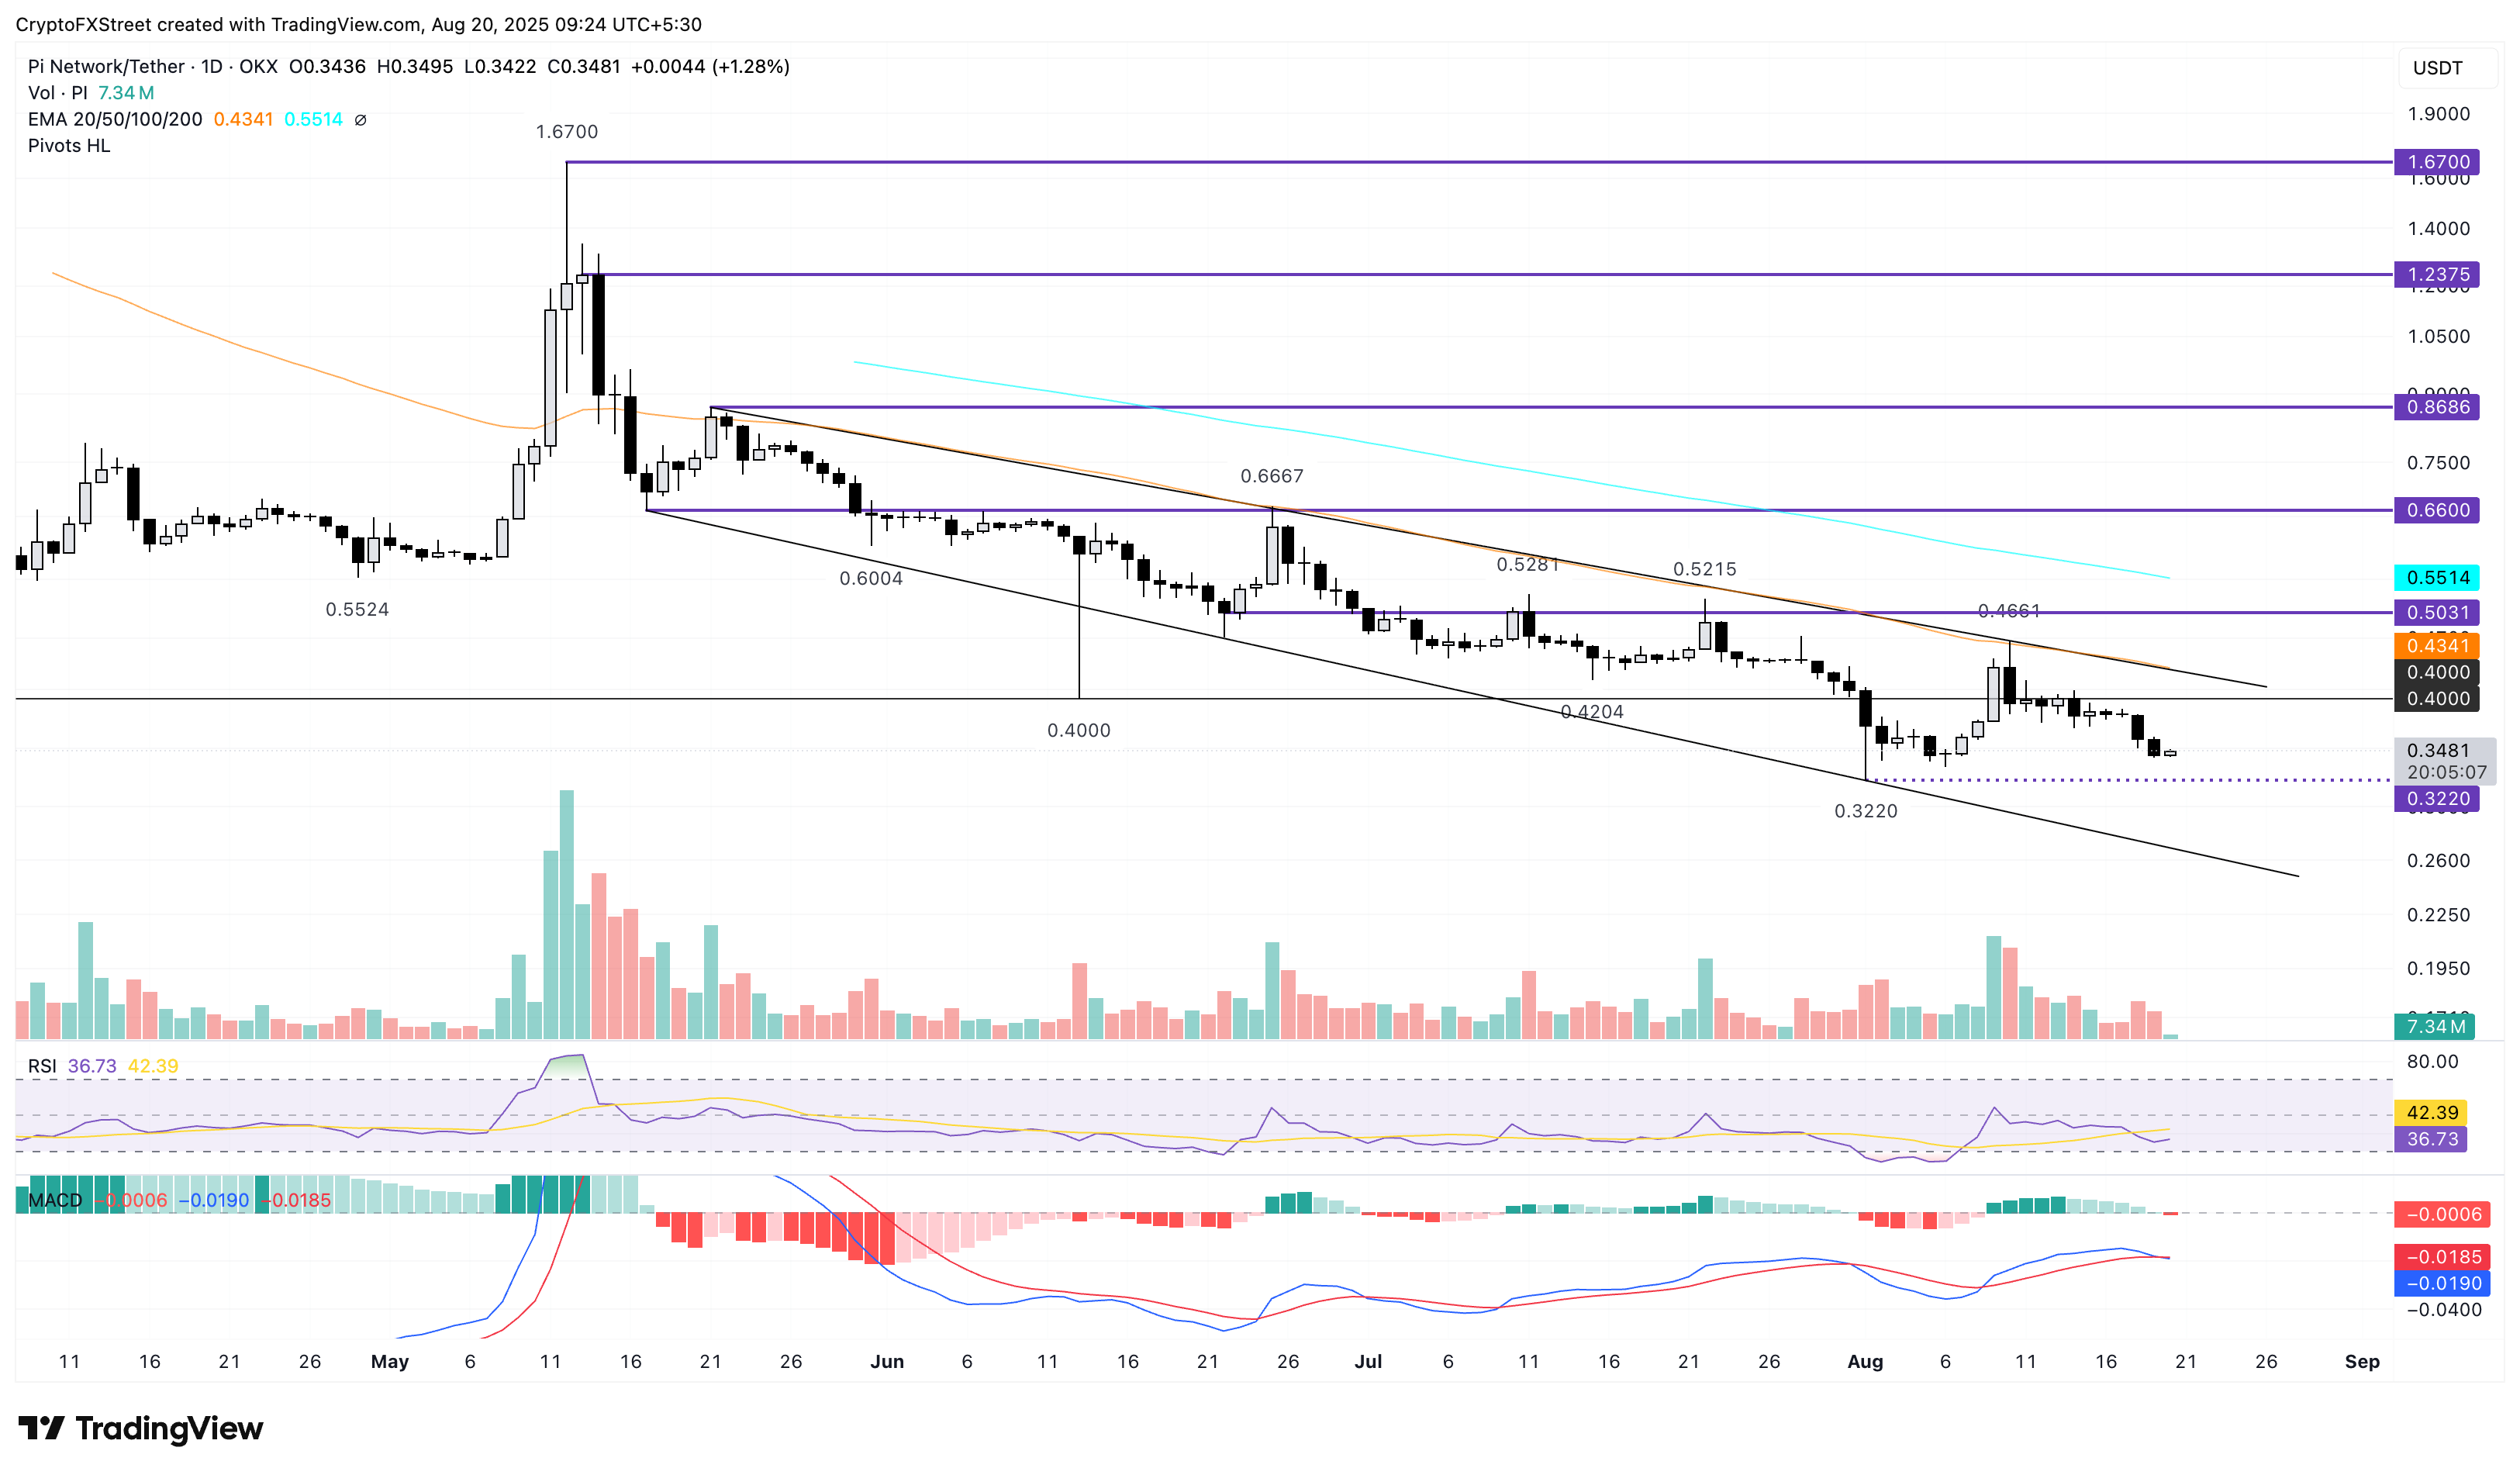
PI/USDT daily price chart.
Looking up, the PI token should reclaim the $0.4000 level to retest the overhead trendline at $0.4342.
Open Interest, funding rate FAQs
Higher Open Interest is associated with higher liquidity and new capital inflow to the market. This is considered the equivalent of increase in efficiency and the ongoing trend continues. When Open Interest decreases, it is considered a sign of liquidation in the market, investors are leaving and the overall demand for an asset is on a decline, fueling a bearish sentiment among investors.
Funding fees bridge the difference between spot prices and prices of futures contracts of an asset by increasing liquidation risks faced by traders. A consistently high and positive funding rate implies there is a bullish sentiment among market participants and there is an expectation of a price hike. A consistently negative funding rate for an asset implies a bearish sentiment, indicating that traders expect the cryptocurrency’s price to fall and a bearish trend reversal is likely to occur.
Author

Vishal Dixit
FXStreet
Vishal Dixit holds a B.Sc. in Chemistry from Wilson College but found his true calling in the world of crypto.


