Pi Network Price Analysis: PI consolidates in a bear channel, eyes breakout
- Pi Network’s PI token struggles at $0.40 as it bounces off within a falling channel pattern.
- The increasing greed in the crypto market reflects growing risk-on sentiment among investors.
- A potential altcoin season could catalyze the next bullish run in the PI token.
Pi Network (PI) is holding at $0.40 at press time on Thursday, extending the consolidation range seen in the past few days within a larger falling channel pattern. PI token bulls eye the next leg higher as the selling pressure fades, potentially leading to a channel breakout.
As the broader cryptocurrency market reaches a record high of $4.15 trillion, rising risk-on sentiment and the potential for an altcoin season could act as additional catalysts for PI.
Optimism sparks among crypto investors
CoinMarketCap data shows that investor greed, on a scale of 0 to 100, is at 68, up from 63 on Wednesday. This heightened greed correlates with the return of risk-on sentiment among investors, fueling capital inflows and driving Bitcoin (BTC) and other top altcoins to reach all-time highs.
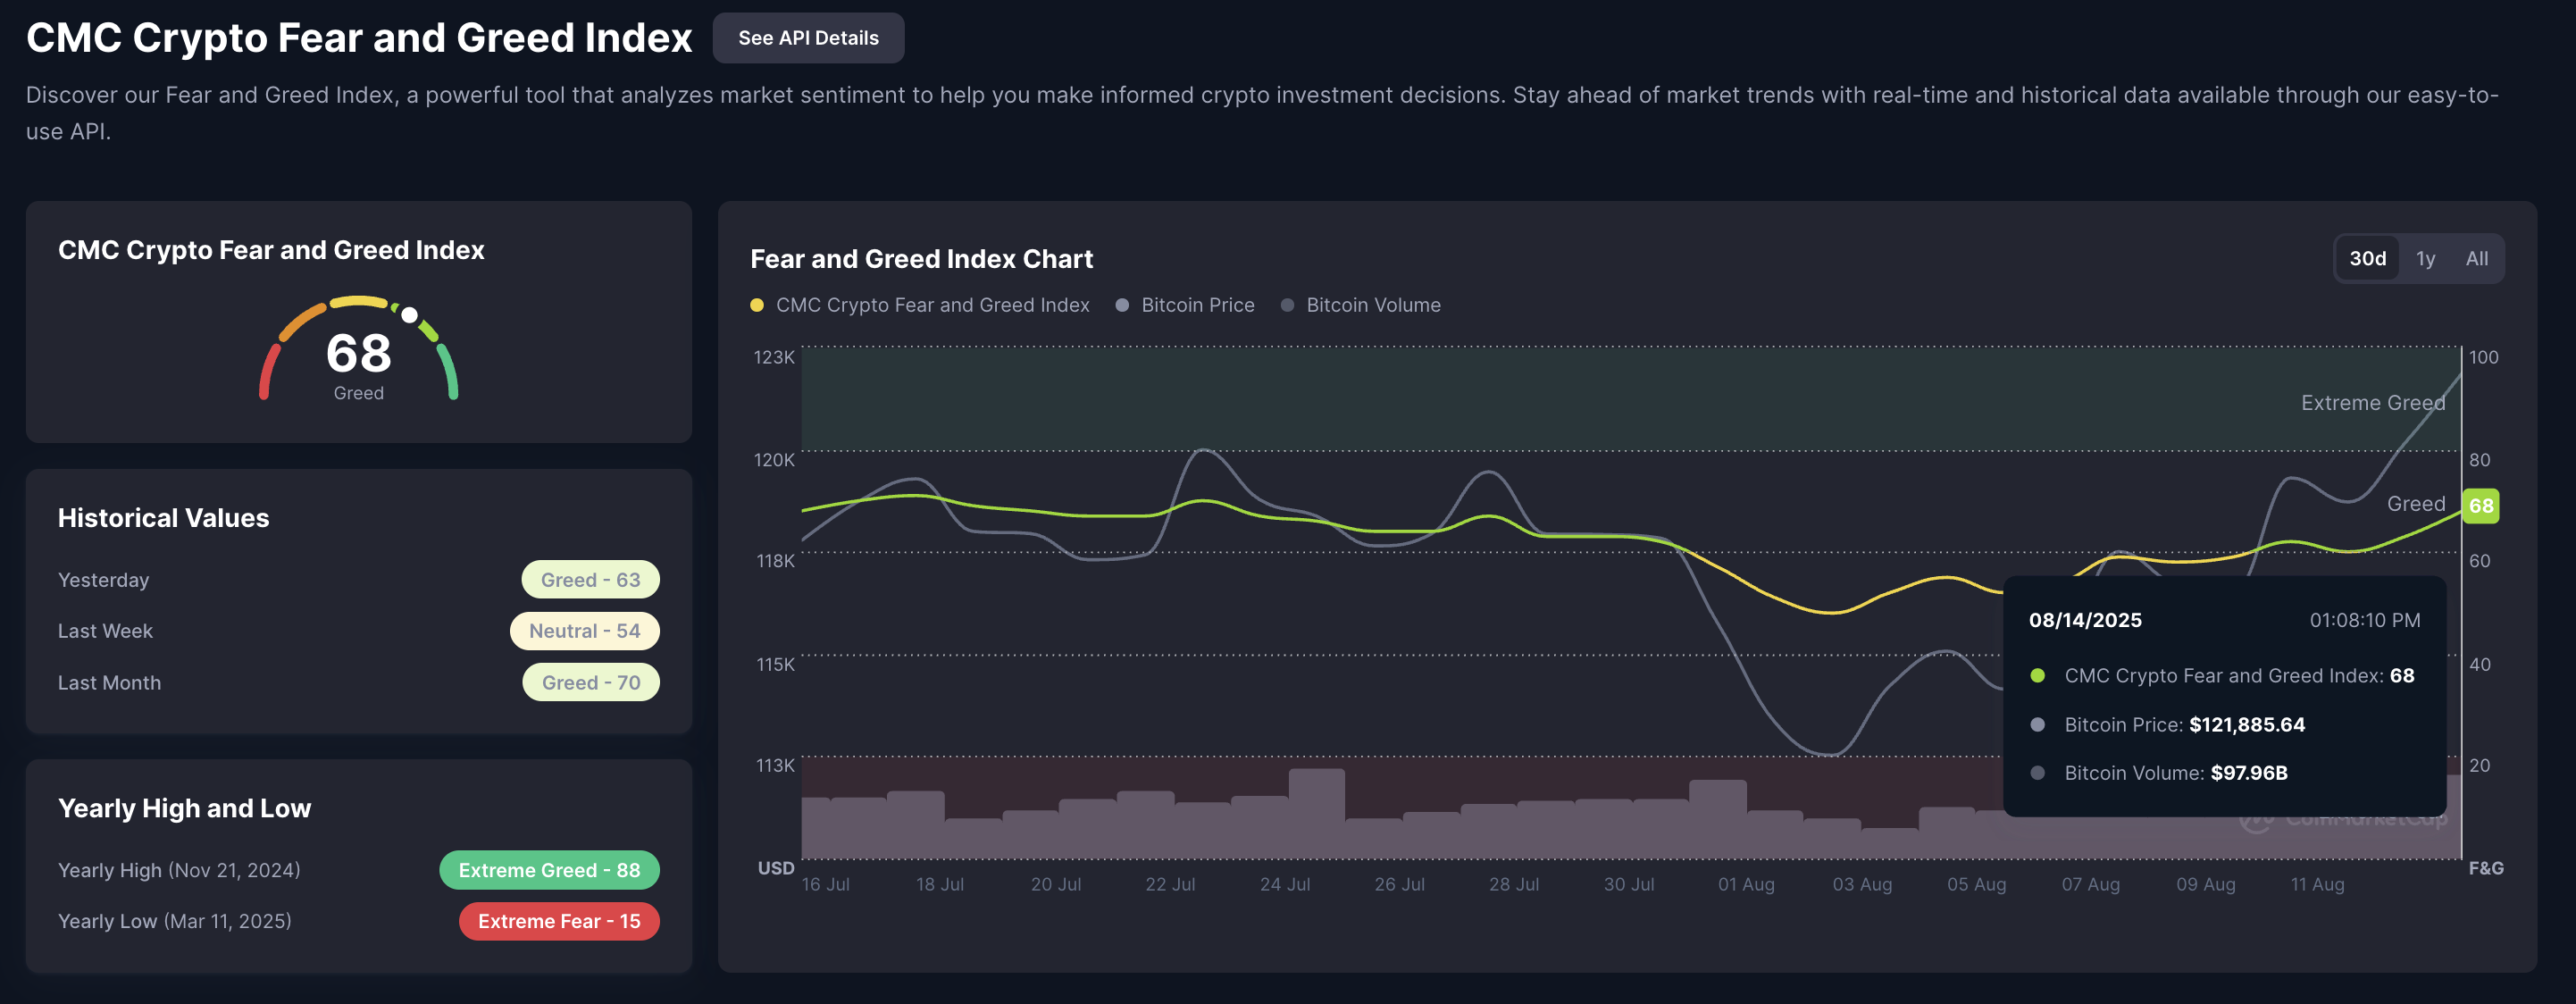
Crypto Fear and Greed Index. Source: CoinMarketCap
Additionally, the Altcoin Season Index is at 41, up from last week’s 39 and last month’s 32, indicating increasing chances of a potential altcoin season. In the next potential altseason, Pi Network could experience increased capital inflow as the capital rotates from Bitcoin and other top altcoins toward riskier and more volatile cryptocurrencies such as PI.
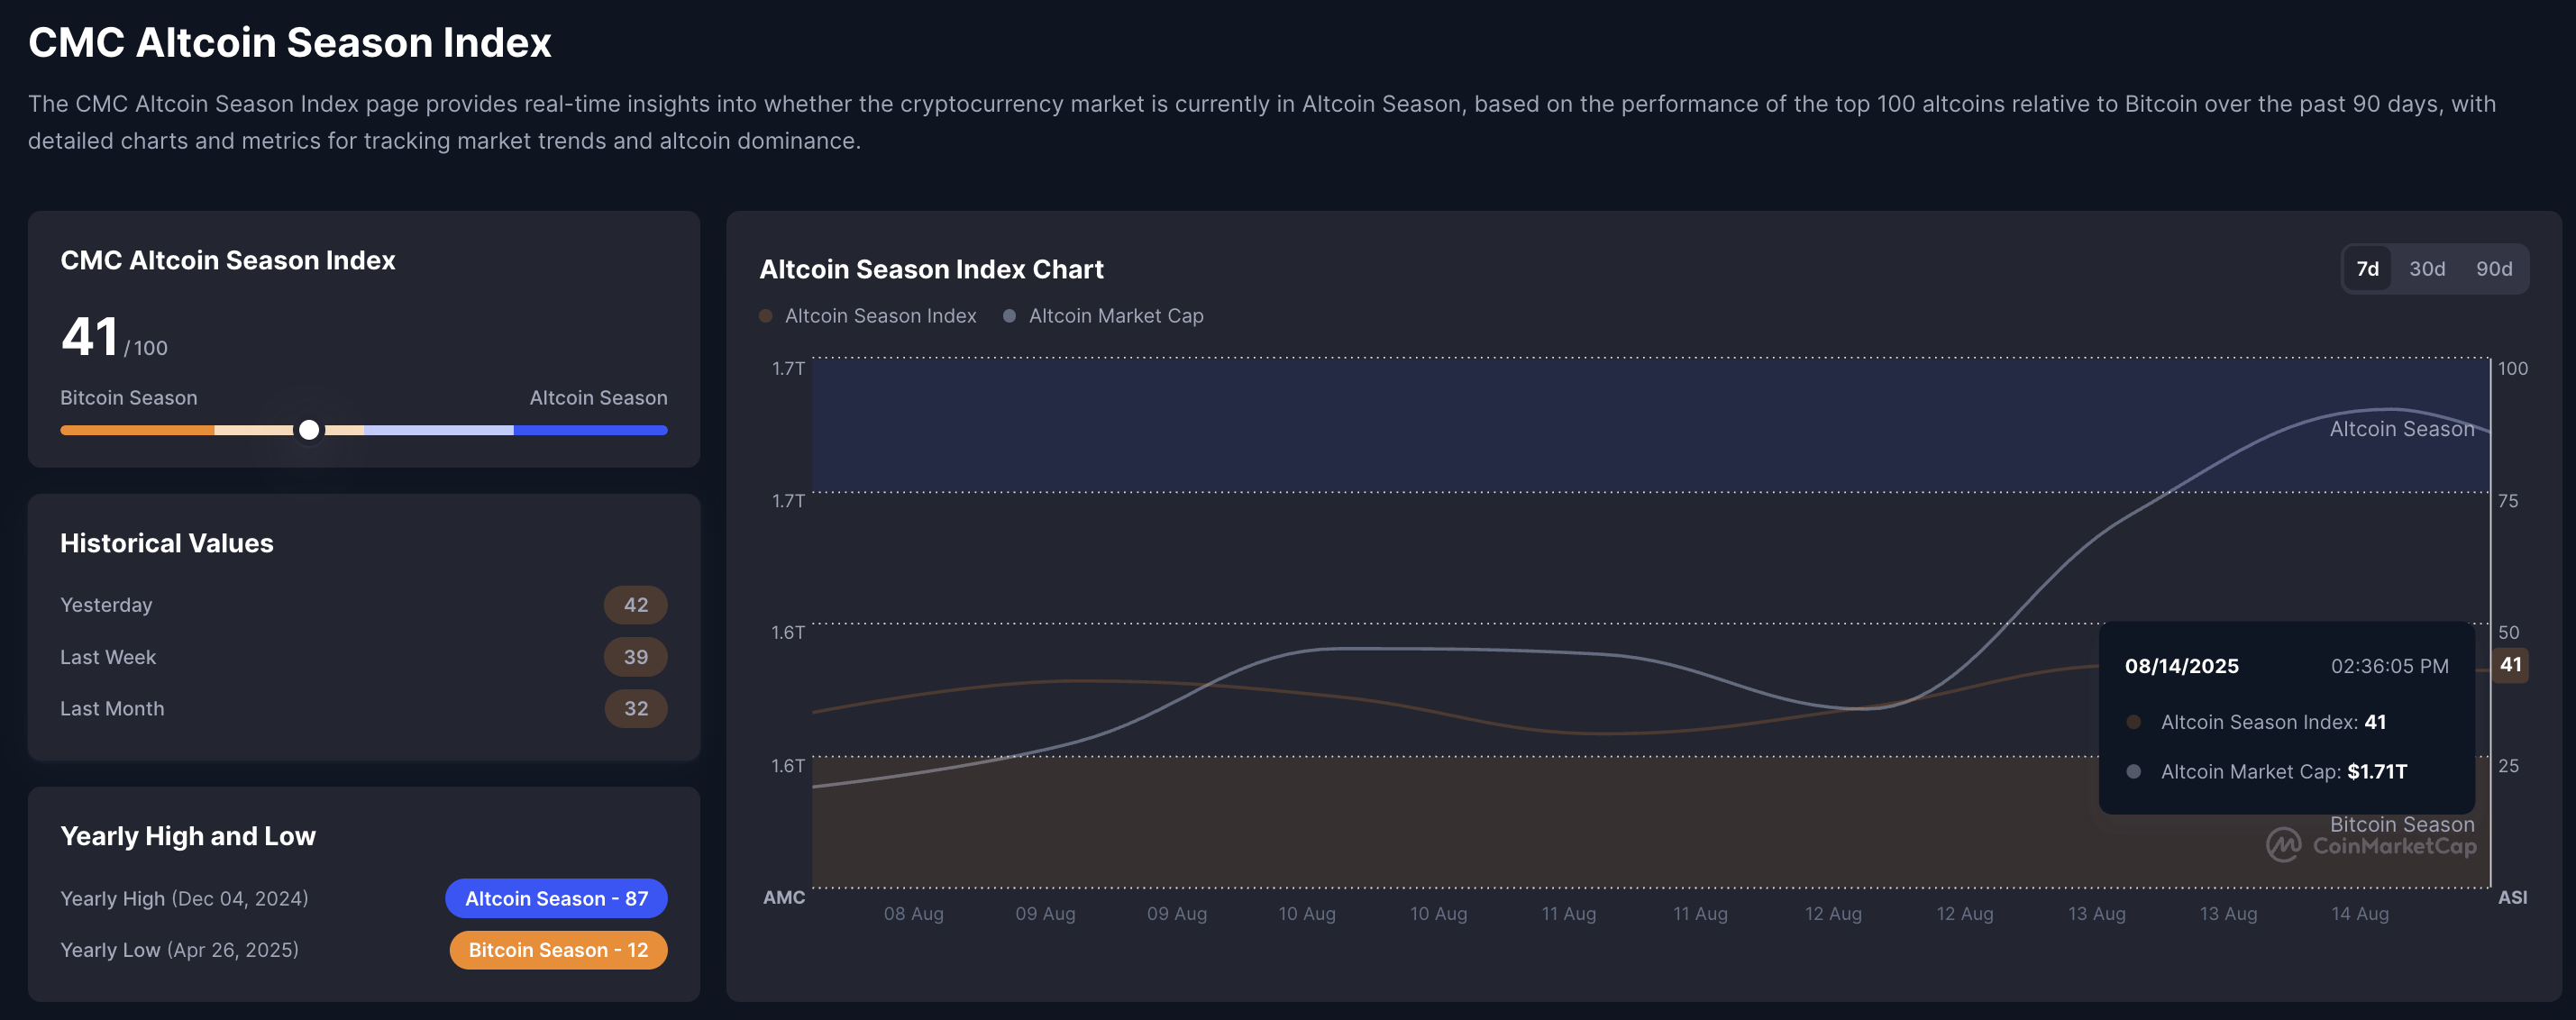
Altcoin Season Index. Source: CoinMarketCap
Pi Network looks out for a channel breakout rally
The PI token holds steady near the $0.40 level, extending the muted sideways price action after the sharp 9.32% drop on Sunday. PI token’s reversal marks a negative cycle within a falling channel as it fell from the overhead trendline formed by connecting the highs of May 21 and June 25.
A trendline connected by the lows of May 17 and June 22 forms the lower boundary of the falling channel pattern. To reinforce a trend reversal, PI should surpass the overhead trendline, which is near the declining 50-day Exponential Moving Average (EMA) at $0.45.
The Moving Average Convergence Divergence (MACD) trend is upward, indicating rising bullish momentum. Still, the Relative Strength Index (RSI) reads 47 on the daily chart, as it moves flat below the halfway line. This indicates the fading selling pressure near the neutral level, but also a lack of buying pressure.
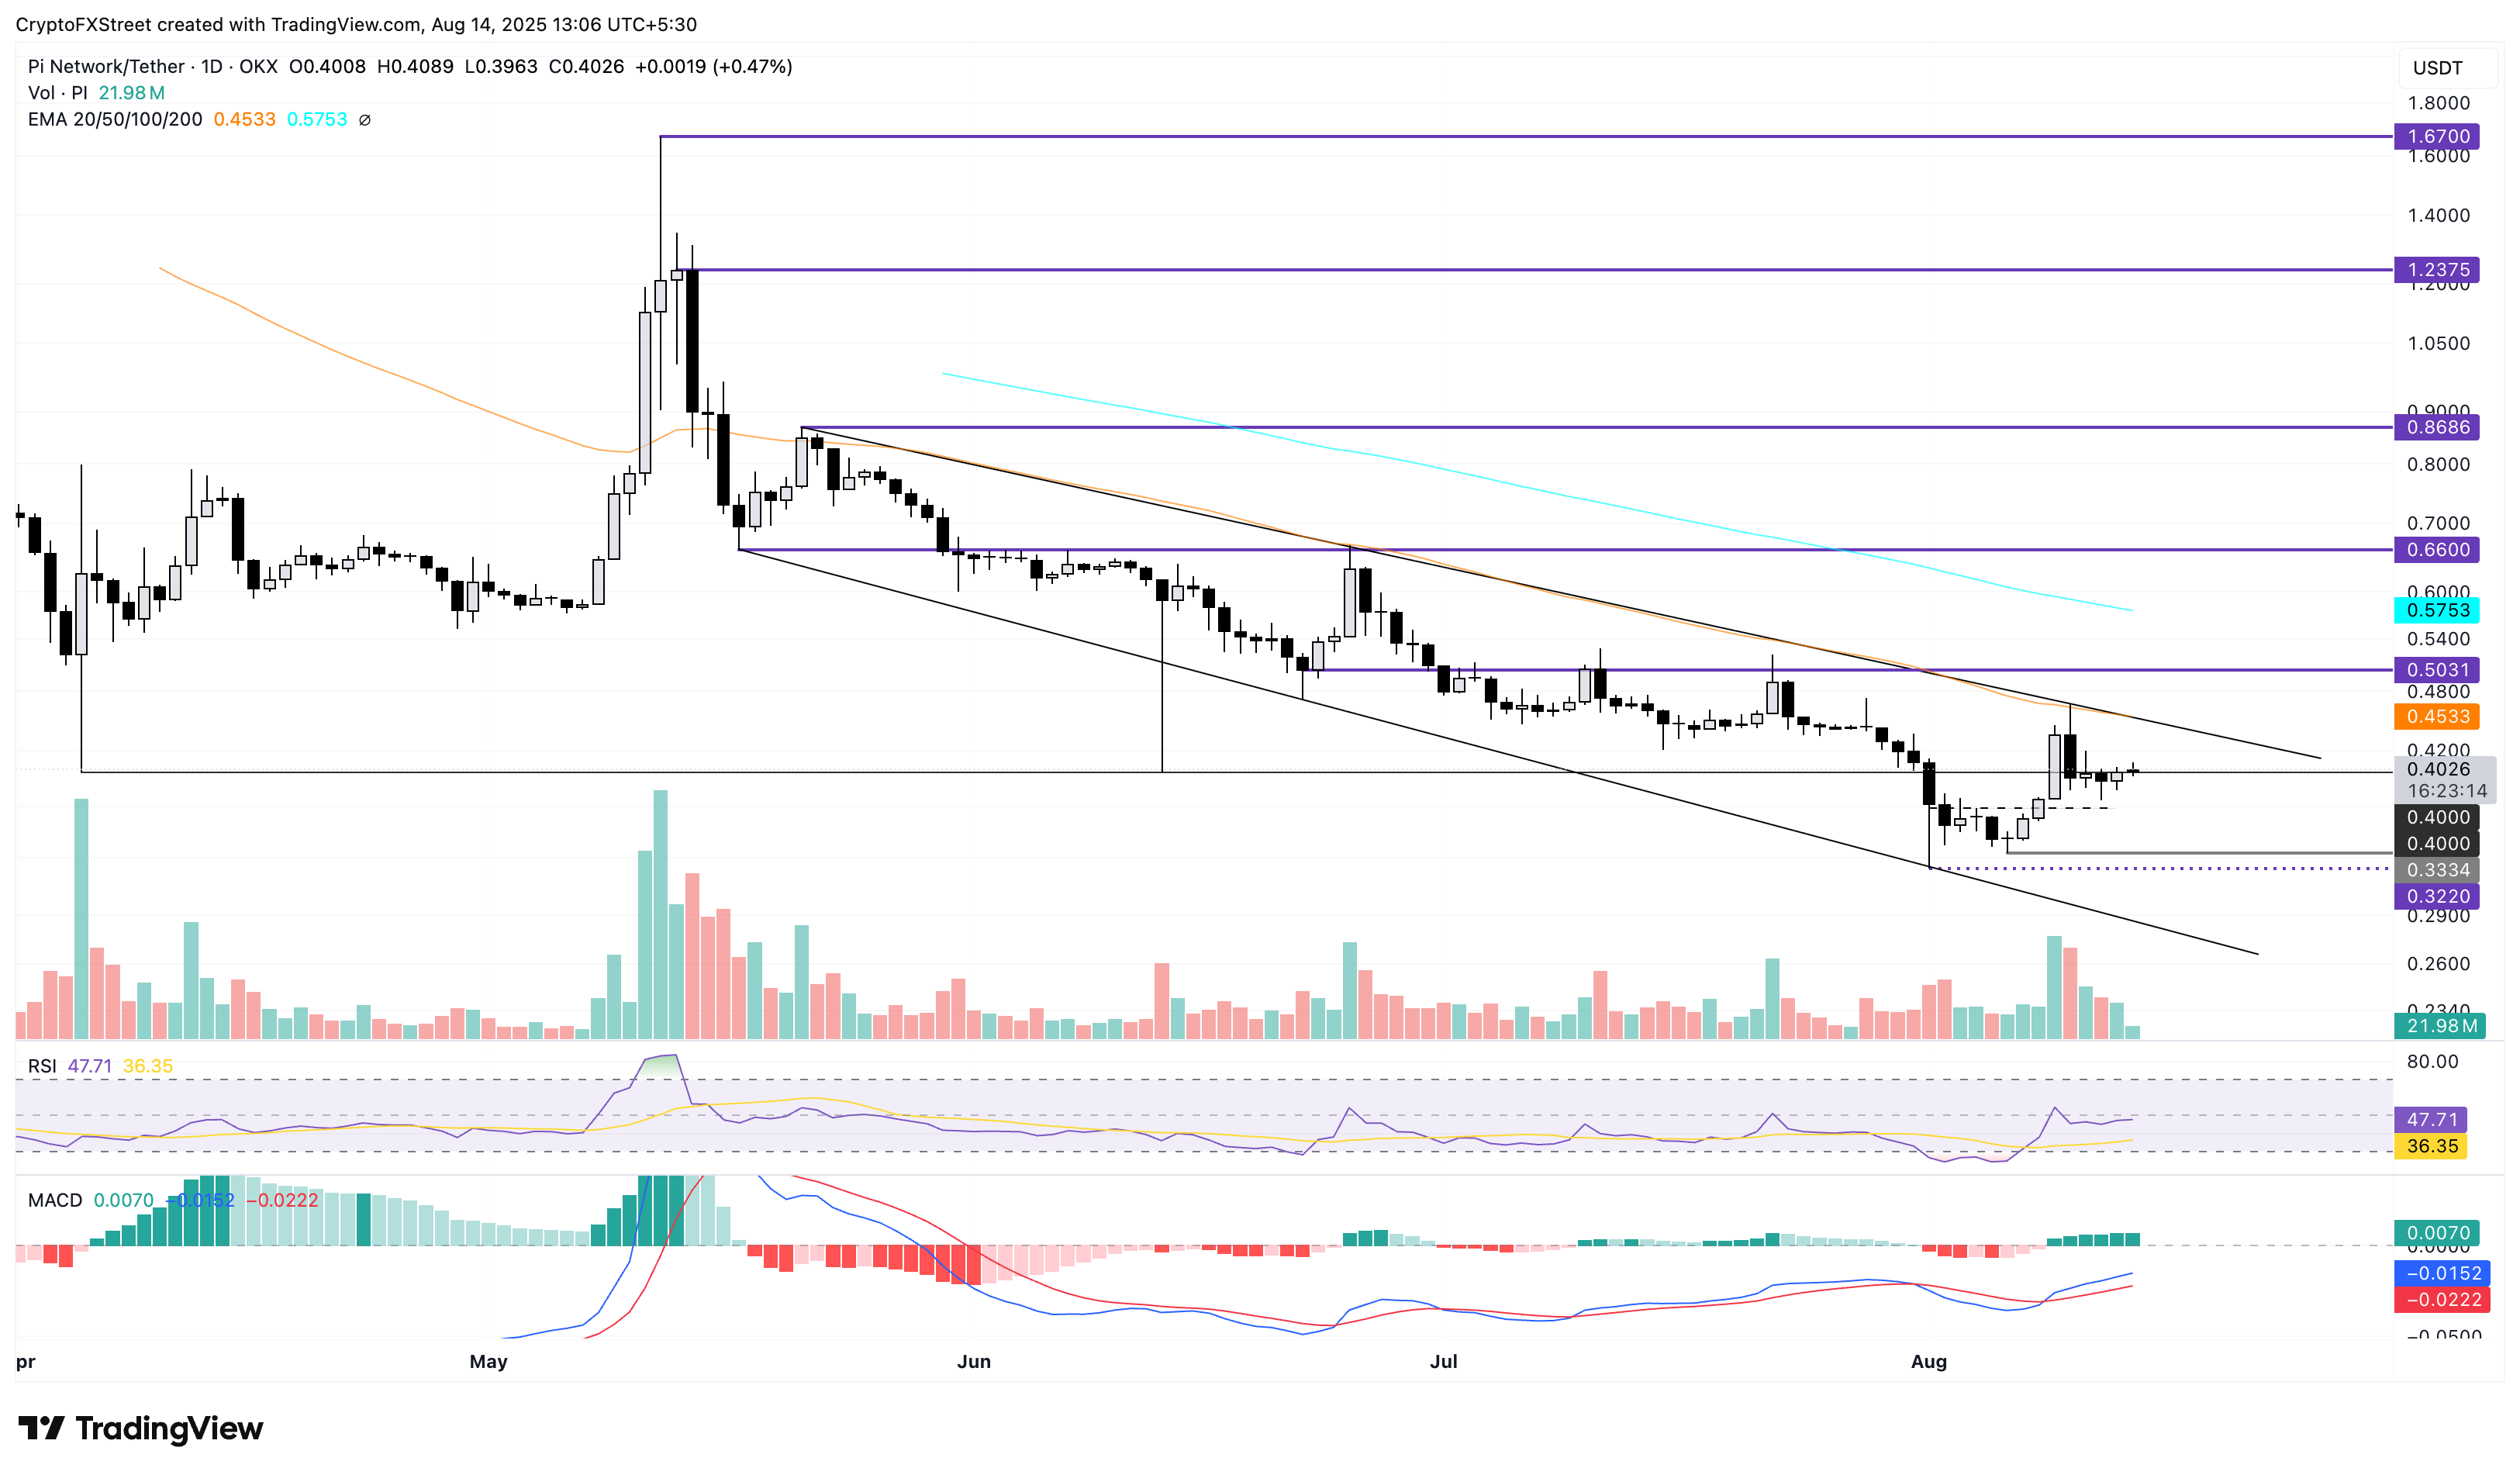
PI/USDT daily price chart.
Looking down, an extended correction in Pi Network could test the $0.37 support zone, followed by the $0.33 level marked by the low from August 6.
Open Interest, funding rate FAQs
Higher Open Interest is associated with higher liquidity and new capital inflow to the market. This is considered the equivalent of increase in efficiency and the ongoing trend continues. When Open Interest decreases, it is considered a sign of liquidation in the market, investors are leaving and the overall demand for an asset is on a decline, fueling a bearish sentiment among investors.
Funding fees bridge the difference between spot prices and prices of futures contracts of an asset by increasing liquidation risks faced by traders. A consistently high and positive funding rate implies there is a bullish sentiment among market participants and there is an expectation of a price hike. A consistently negative funding rate for an asset implies a bearish sentiment, indicating that traders expect the cryptocurrency’s price to fall and a bearish trend reversal is likely to occur.
Author

Vishal Dixit
FXStreet
Vishal Dixit holds a B.Sc. in Chemistry from Wilson College but found his true calling in the world of crypto.


