Pi Network Price Forecast: Pi risk losses ignoring second migration hints, Hackathon announcement
- Pi risks further losses within a falling channel pattern as bullish momentum fades.
- The announcement of Pi Hackathon 2025 received adverse feedback from the community.
- Pi Moderator hints at the second migration of PI tokens from testnet to mainnet, possibly in 2025.
Pi Network (PI) edges lower by over 1% at press time on Monday, shifting from a consolidation phase. The downside risk escalates as PI forms a falling channel, ignoring the announcement of Pi Hackathon 2025 and a moderator hinting at a potential second migration event.
Pi Hackathon struggles to uplift community sentiment
Pi Network announced the start of Pi Hackathon 2025 registration on Friday, aiming to boost Mainnet app development with real-world use cases by incentivizing developers. The event has a total prize of 160,000 Pi and requires a working app and demo video by October 15.

The community shared adverse feelings about the Pi Hackathon. Jatin Gupta, a Pioneer, questioned the sudden halt in monthly hackathons from 2023 and anticipates a similar failure. Pioneers are PI token holders or active miners.
Pi moderator hints at second migration event
Pi moderator, one of many volunteers selected by the Pi core team, has replied “I do think it can” to a community member’s question about a possible second migration event this year. The hint comes ahead of the moderators' meeting with Pi Network founders, Nicolas Kokkalis and Chengdiao Fan. The meeting dates are yet to be announced.
PI risks further losses within a falling wedge
PI token edges lower by over 1% at press time on Monday within a falling wedge pattern on the 4-hour chart. The declining trend marks a shift from the short-lived consolidation near the $0.40 level.
The intraday pullback increases the downside risk, with the next potential targets at the $0.3334 support level marked by the August 6 low.
The momentum indicators indicate that the path of least resistance is downward. On the 4-hour chart, the Relative Strength Index (RSI) stands at 41, sloping downward, indicating a decline in buying pressure.
The Moving Average Convergence Divergence (MACD) inches closer to its signal line, risking a crossover. A rise in red histogram bars below the signal line would indicate a bearish shift in trend momentum.
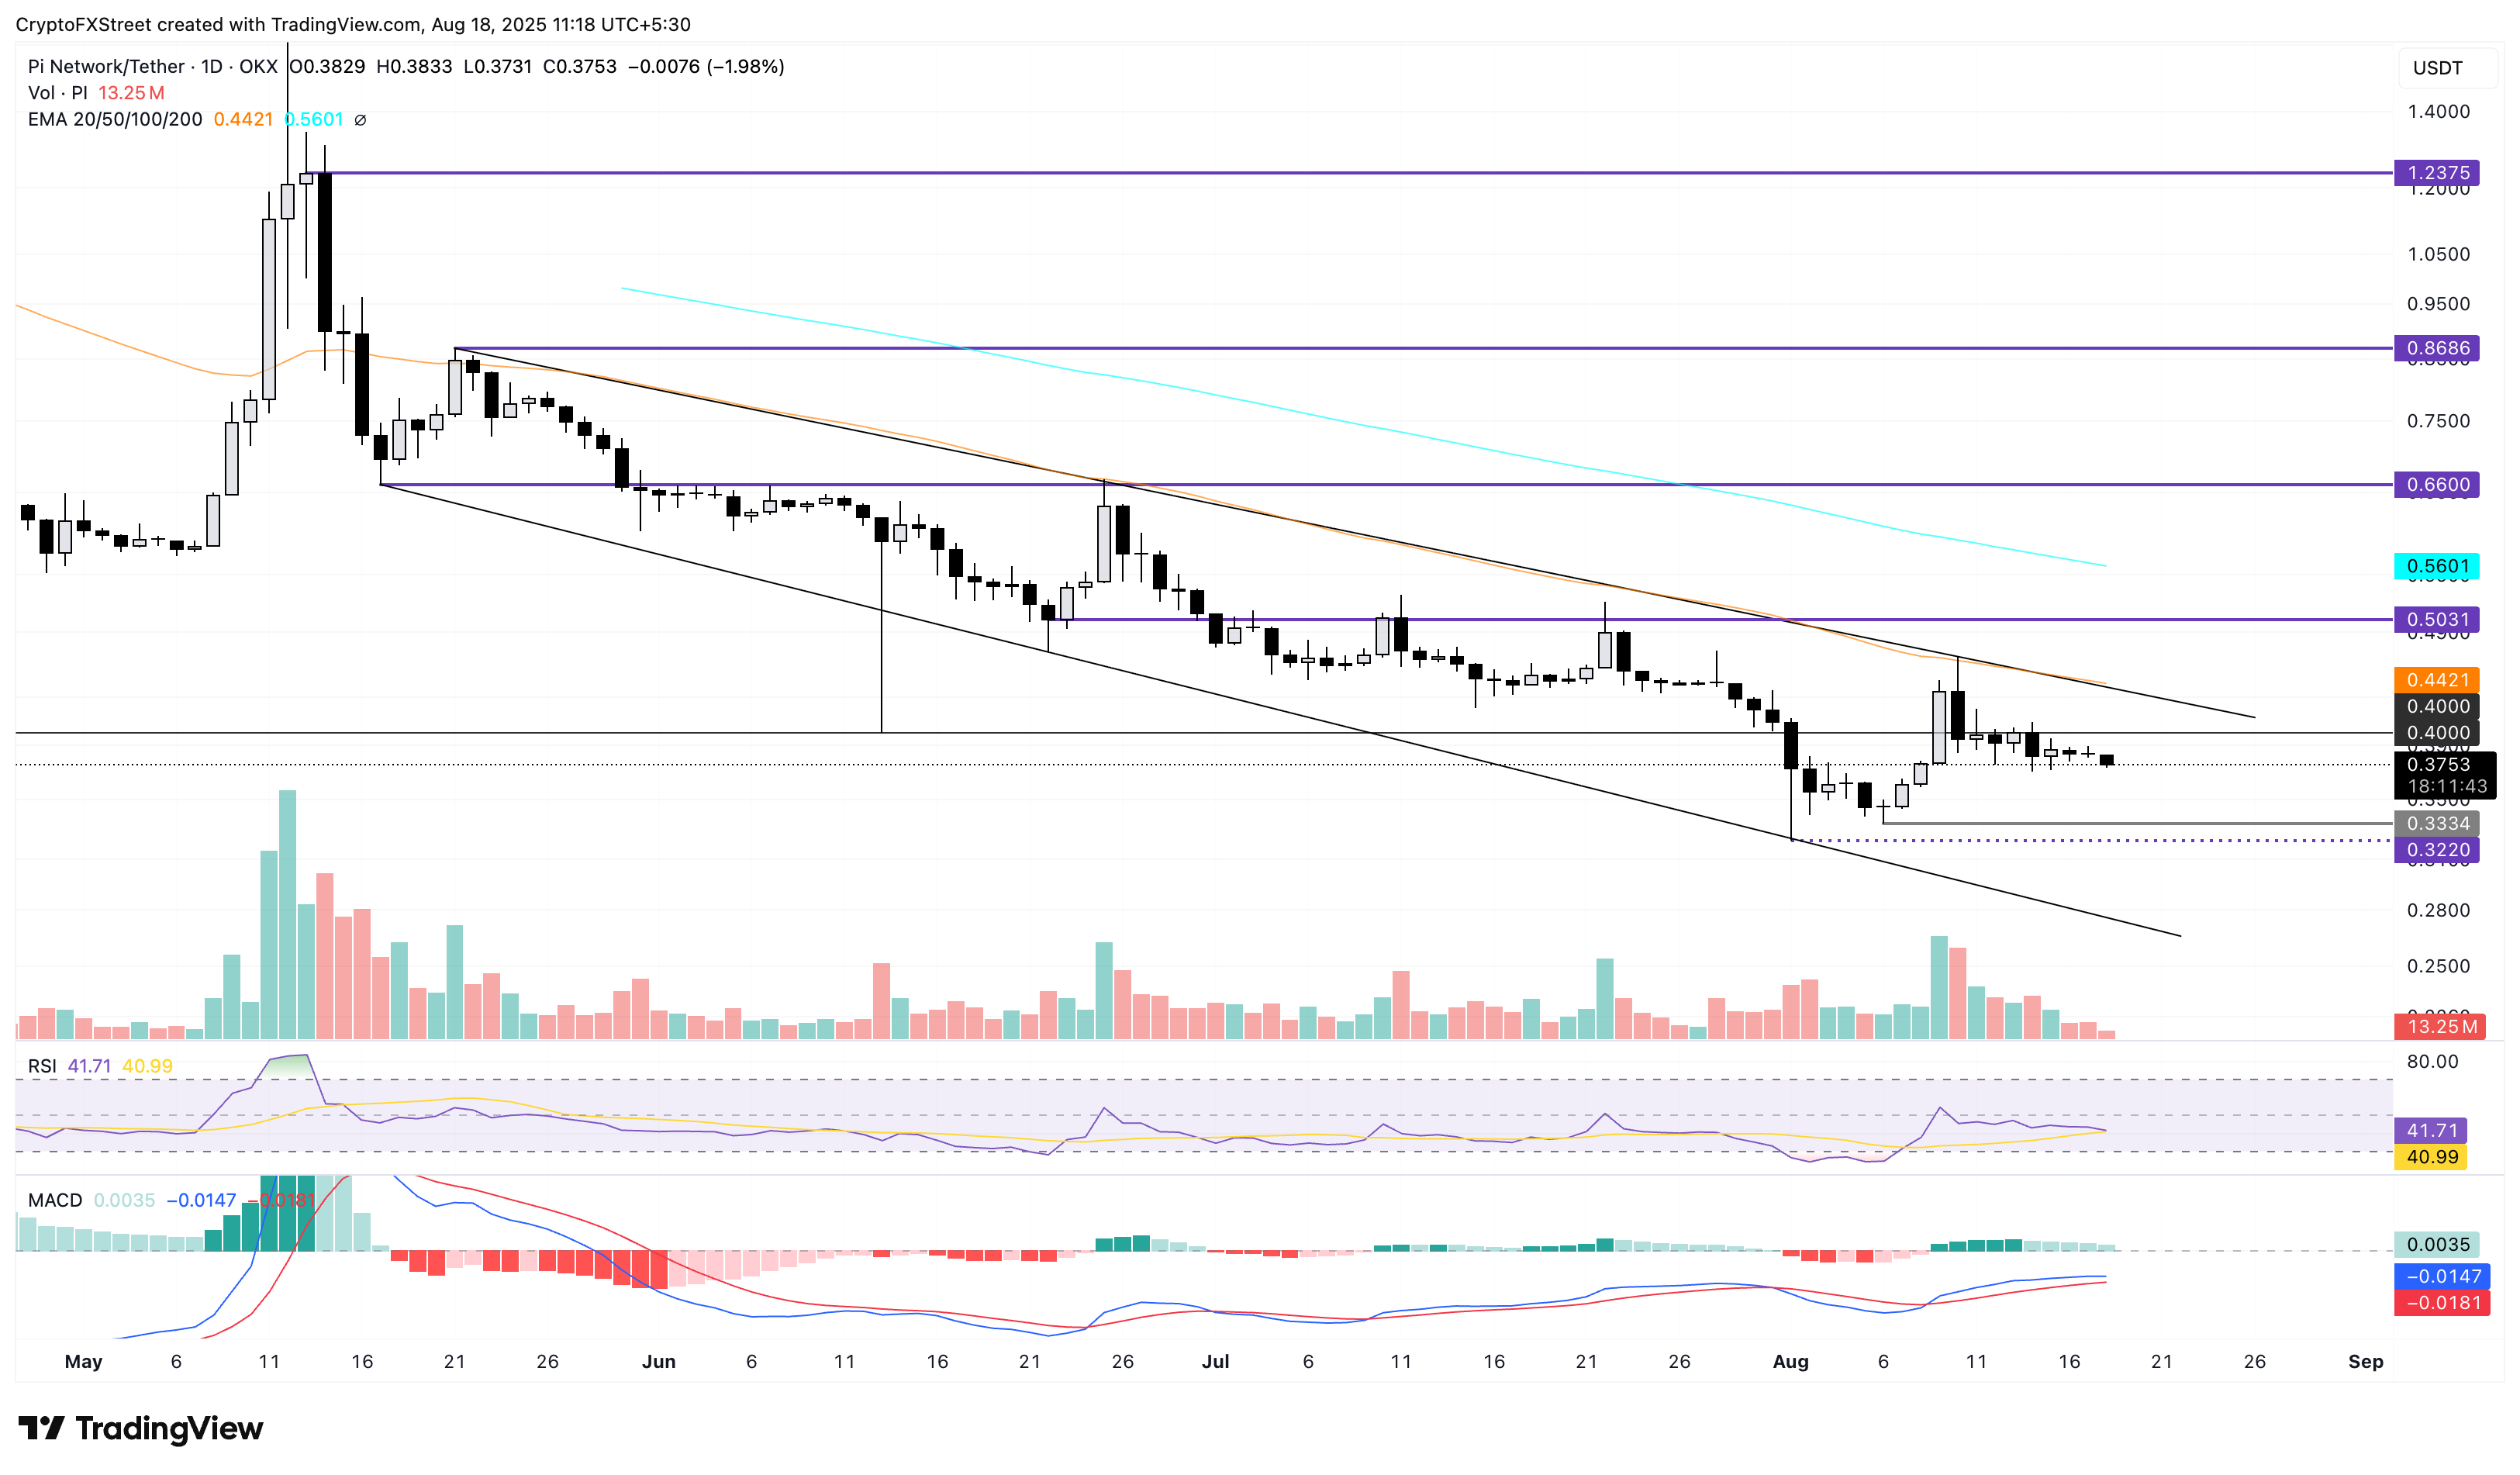
PI/USDT daily price chart.
On the contrary, a pushback in PI above $0.4000 level could extend the uptrend to the 50-period Exponential Moving Average (EMA) at $0.4421.
Open Interest, funding rate FAQs
Higher Open Interest is associated with higher liquidity and new capital inflow to the market. This is considered the equivalent of increase in efficiency and the ongoing trend continues. When Open Interest decreases, it is considered a sign of liquidation in the market, investors are leaving and the overall demand for an asset is on a decline, fueling a bearish sentiment among investors.
Funding fees bridge the difference between spot prices and prices of futures contracts of an asset by increasing liquidation risks faced by traders. A consistently high and positive funding rate implies there is a bullish sentiment among market participants and there is an expectation of a price hike. A consistently negative funding rate for an asset implies a bearish sentiment, indicating that traders expect the cryptocurrency’s price to fall and a bearish trend reversal is likely to occur.
Author

Vishal Dixit
FXStreet
Vishal Dixit holds a B.Sc. in Chemistry from Wilson College but found his true calling in the world of crypto.


