Ontology price is on the verge of a 70% breakout if ONT bulls manage to breach crucial resistance barrier
- Ontology price awaits a bullish breakout from a multi-year consolidation pattern on a weekly time frame.
- The increasing volume activity suggests massive accumulation underway.
- On-chain data reveals a crucial resistance barrier at $0.70.
Ontology price moves closer to a pivotal point in its trend. A spike in upward pressure could be succeeded by a highly volatile movement because ONT has remained stagnant since December 2018.
Ontology price primed for a breakout from a multi-year consolidation pattern
ONT has been on a downtrend since mid-2018 forming a descending triangle along the way. Interestingly enough, its recent price action shows large spikes in buy volume, hinting that some market participants have been accumulating heavily over the past few months.
As a result, bullish divergence developed since trading volume has been rising while Ontology price has been making a series of lower highs.
A bullish breakout could come into play if ONT manages to slice through the triangle's hypotenuse at $0.75. In which case, the pattern forecasts a 70% target that might see Ontology price rise to $1.40.
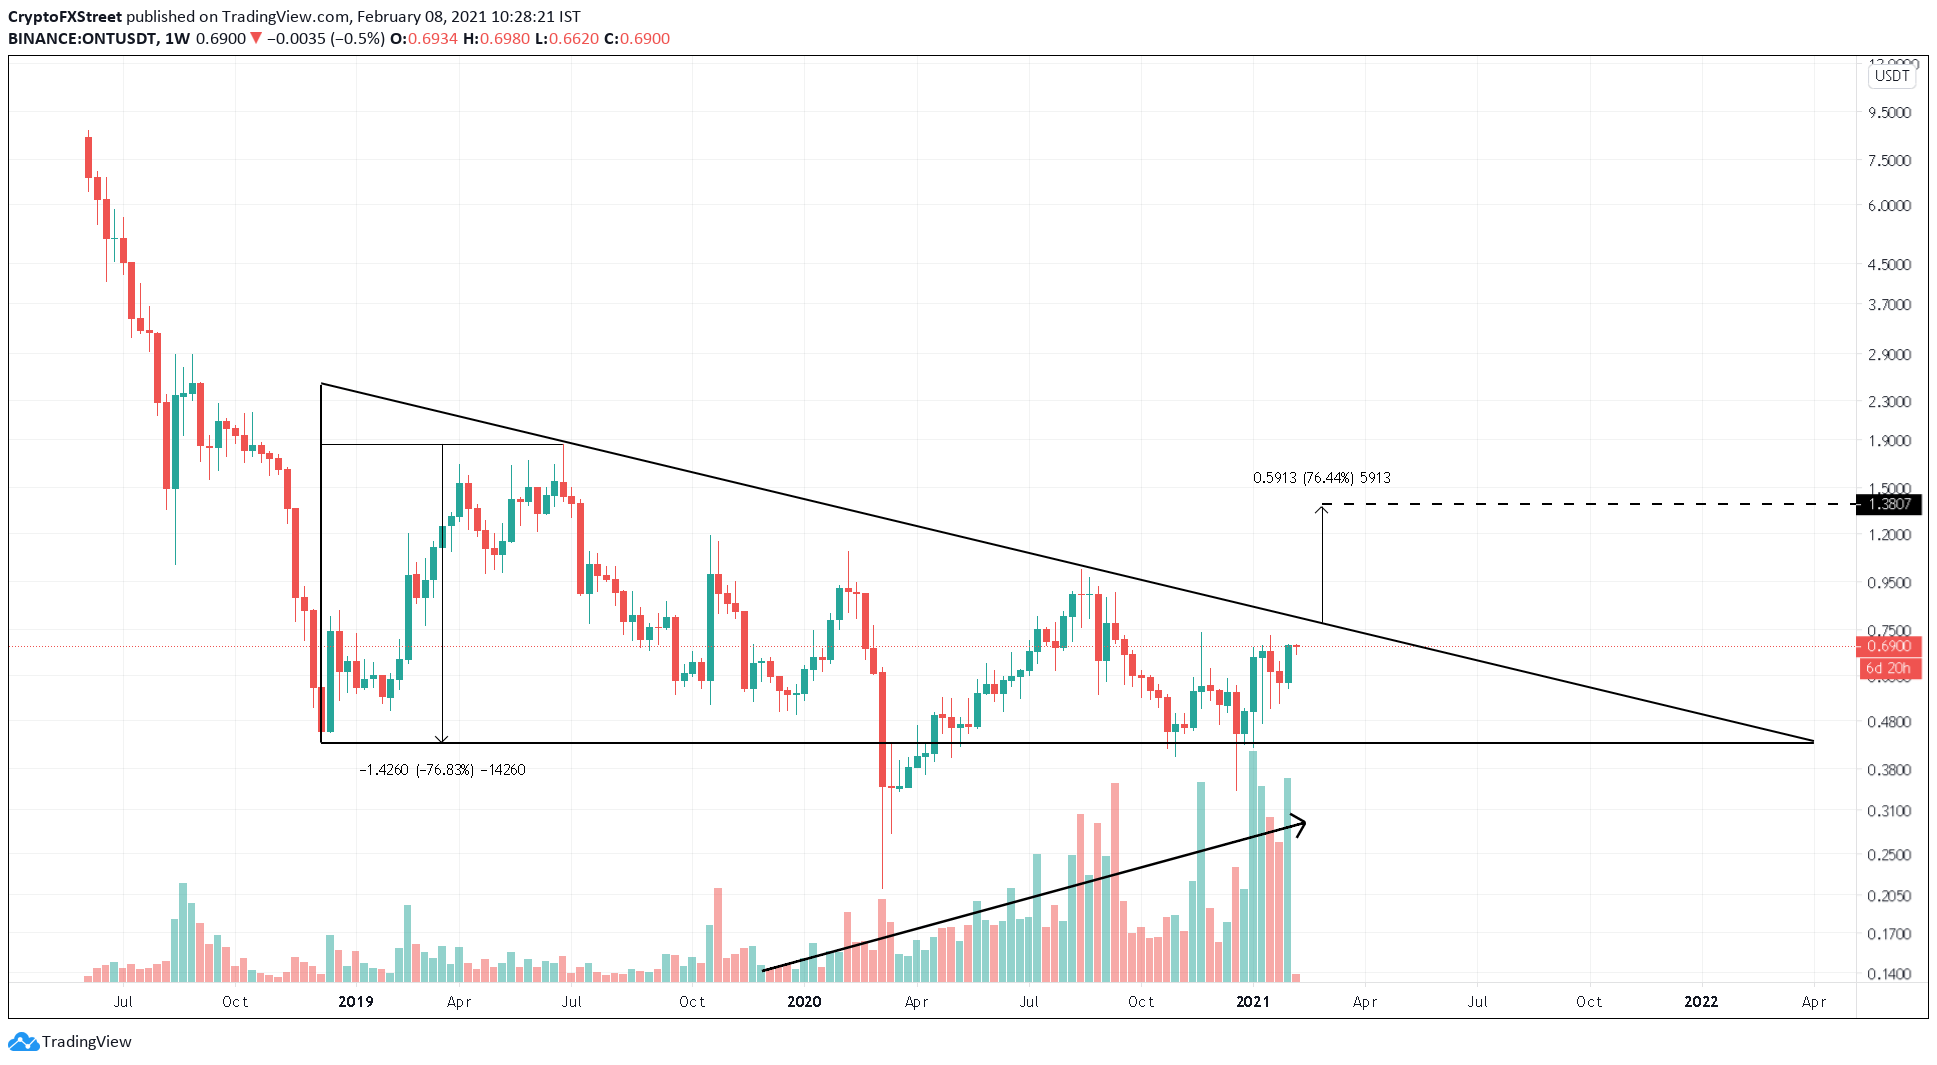
ONT/USDT 1-week chart
The number of new daily addresses joining the network adds credence to the bullish outlook.
Roughly 142 addresses were being created in late December 2020. Now, this number has risen to 311 addresses, representing a 120% increase.
The sudden spike in network growth can be seen as a steady surge in user adoption, which can significantly benefit Ontology price.
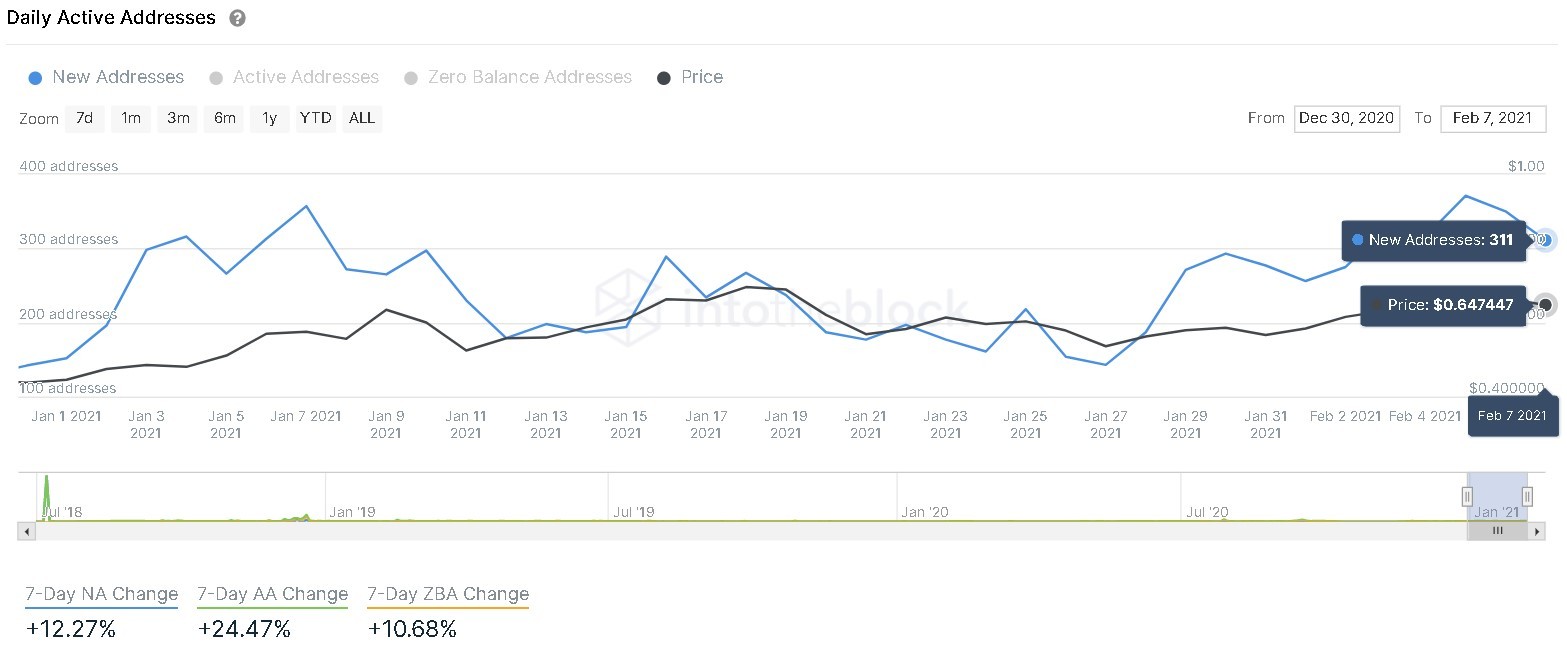
Ontology Daily New Addresses chart
Nonetheless, Ontology faces stiff resistance based on IntoTheBlock’s In/Out of the Money Around Price model. This on-chain metric shows investors' presence around the $0.75 level, where roughly 600 addresses purchased nearly 13 million ONT.
Since these holders are "Out of the Money," they could absorb the buying pressure and reduce Ontology's upward momentum. Therefore, ONT needs to slice through this resistance level to have any chance of surging towards $1.40.
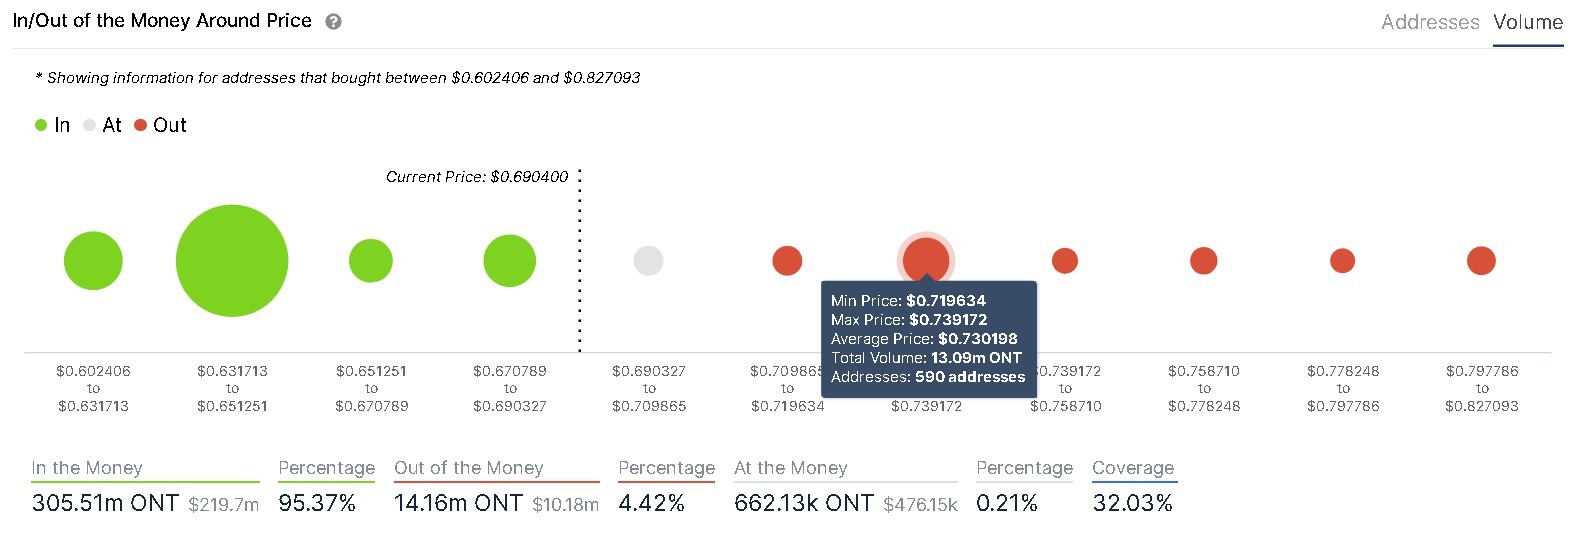
Ontology IOMAP
While everything seems to be looking up for Ontology price, the bearish outlook cannot be overlooked. A breakdown of the $0.65 support could invalidate the bullish thesis. A resulting downswing could push ONT towards the base of the triangle at $0.40
Author

Akash Girimath
FXStreet
Akash Girimath is a Mechanical Engineer interested in the chaos of the financial markets. Trying to make sense of this convoluted yet fascinating space, he switched his engineering job to become a crypto reporter and analyst.


