Ondo Price Forecast: Multiple trendline rejections, fading bullish momentum warn of a steeper correction
- Ondo price hovers around $0.3700 on Wednesday, risking a bearish impulse move from a crucial resistance trendline.
- Retail sentiment remains bullish, with rising volume and Open Interest, and a positive funding rate.
- The technical outlook for ONDO is mildly bearish as the trendline continues to cap bullish breakout attempts.

Ondo (ONDO) price hovers around $0.3700 at press time on Wednesday, maintaining a broader corrective phase under the influence of a resistance trendline. Retail demand for ONDO remains firm, driven by the tokenization trend for traditional stocks and other Real World Assets (RWAs). The technical outlook leans mildly bearish as momentum fades and the overhead trendline continues to cap breakout attempts.
Retail demand holds firm
Ondo emerges as a leading altcoin in the RWA tokenization segment, offering multiple US stocks on-chain. Retail demand for ONDO remains firm as investors shift interest toward altcoins with real-world utility, away from Bitcoin, which is struggling near $65,000.
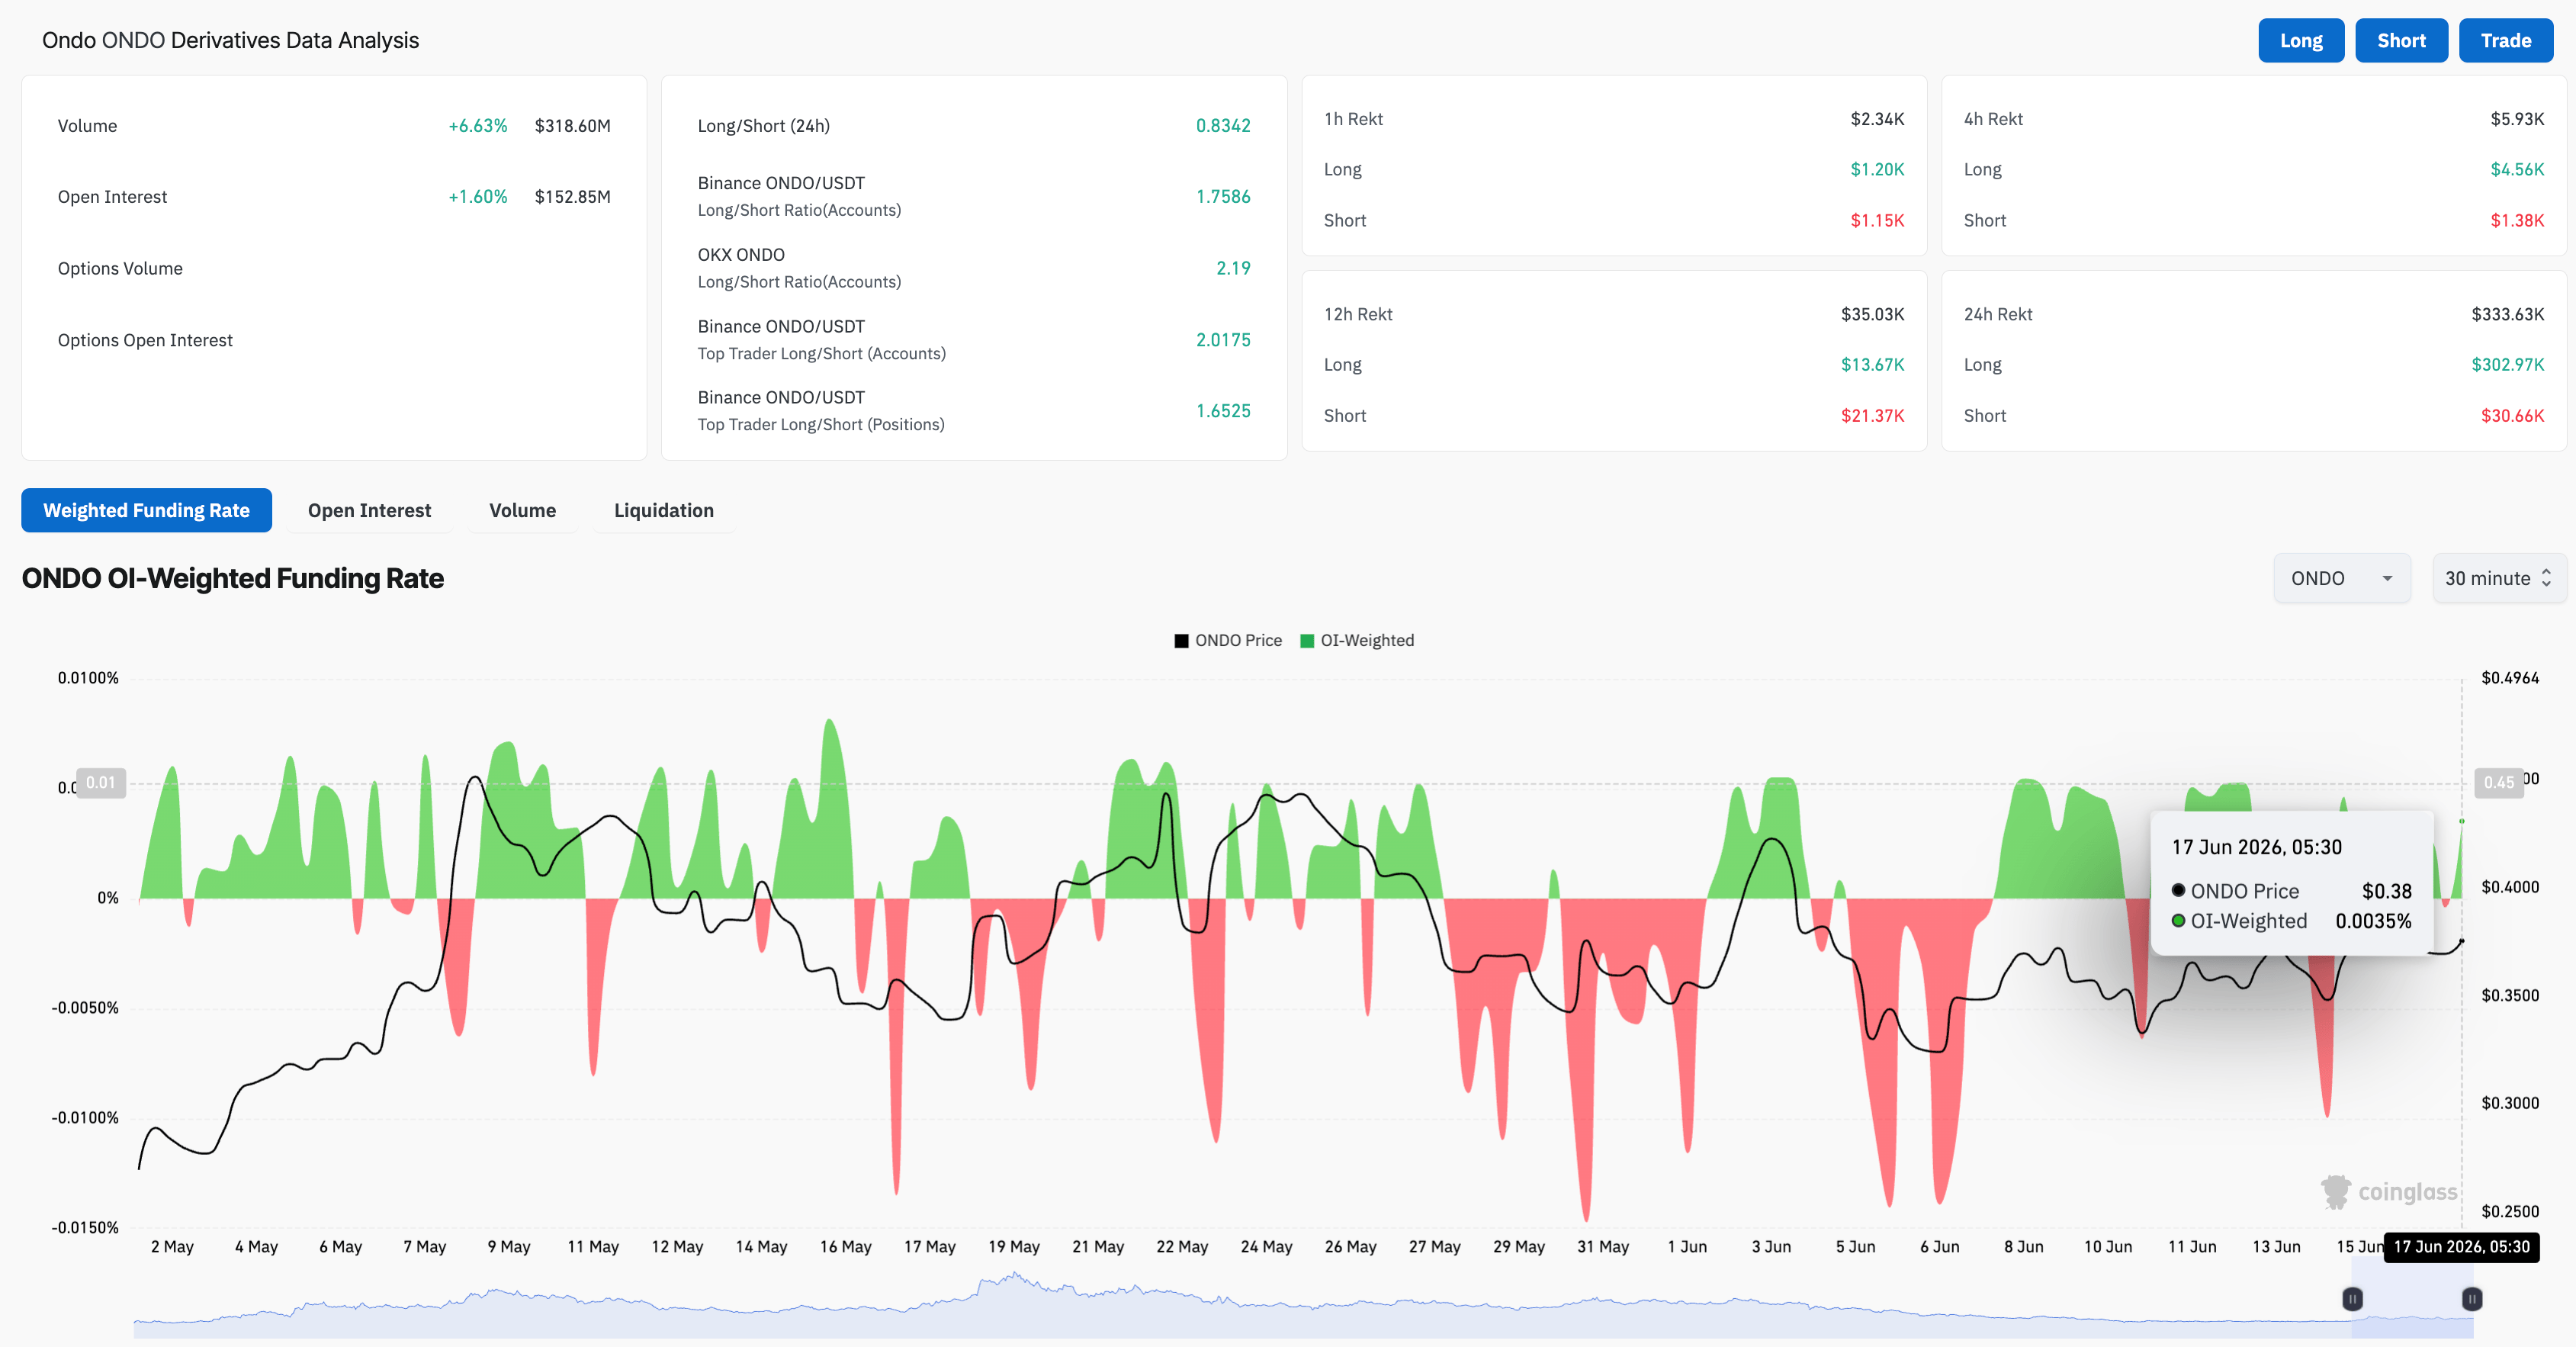
CoinGlass data show that ONDO futures Open Interest (OI) is up 1.60% in the last 24 hours to $152.85 million, with volume up over 6% to $318.60 million. At the same time, a spike in the funding rate to 0.0035% reflects bullish interest among traders, accumulating long positions at a premium.
ONDO struggles at a key resistance confluence
ONDO trades under pressure around $0.3700 on Wednesday after facing multiple rejections from a descending resistance trendline on the 4-hour chart. From a technical perspective, the 50% retracement level at $0.3859, measured over the downswing from $0.4756 to $0.3132, aligns with the trendline, forming a bearish confluence.
That said, ONDO hovers just under the 20-period Simple Moving Average (SMA) at near $0.3705, acting as the midline of the Bollinger Bands on the 4-hour chart. Meanwhile, the price holds above the 50-, 100-, and 200-period Exponential Moving Averages (EMAs) on the same chart, keeping the near-term tone broadly neutral.
The Relative Strength Index (RSI) is close to 50 on the 4-hour chart, while the Moving Average Convergence Divergence (MACD) moves sideways below its signal line, suggesting a muted momentum and a lack of clear directional conviction for now.
Looking down, the 50-, 100-, and 200-period EMAs clustered above $0.3600 collectively hint at a still-supported underlying structure, followed by a rising trendline near $0.3550 and the 23.6% Fibonacci retracement level at $0.3457.
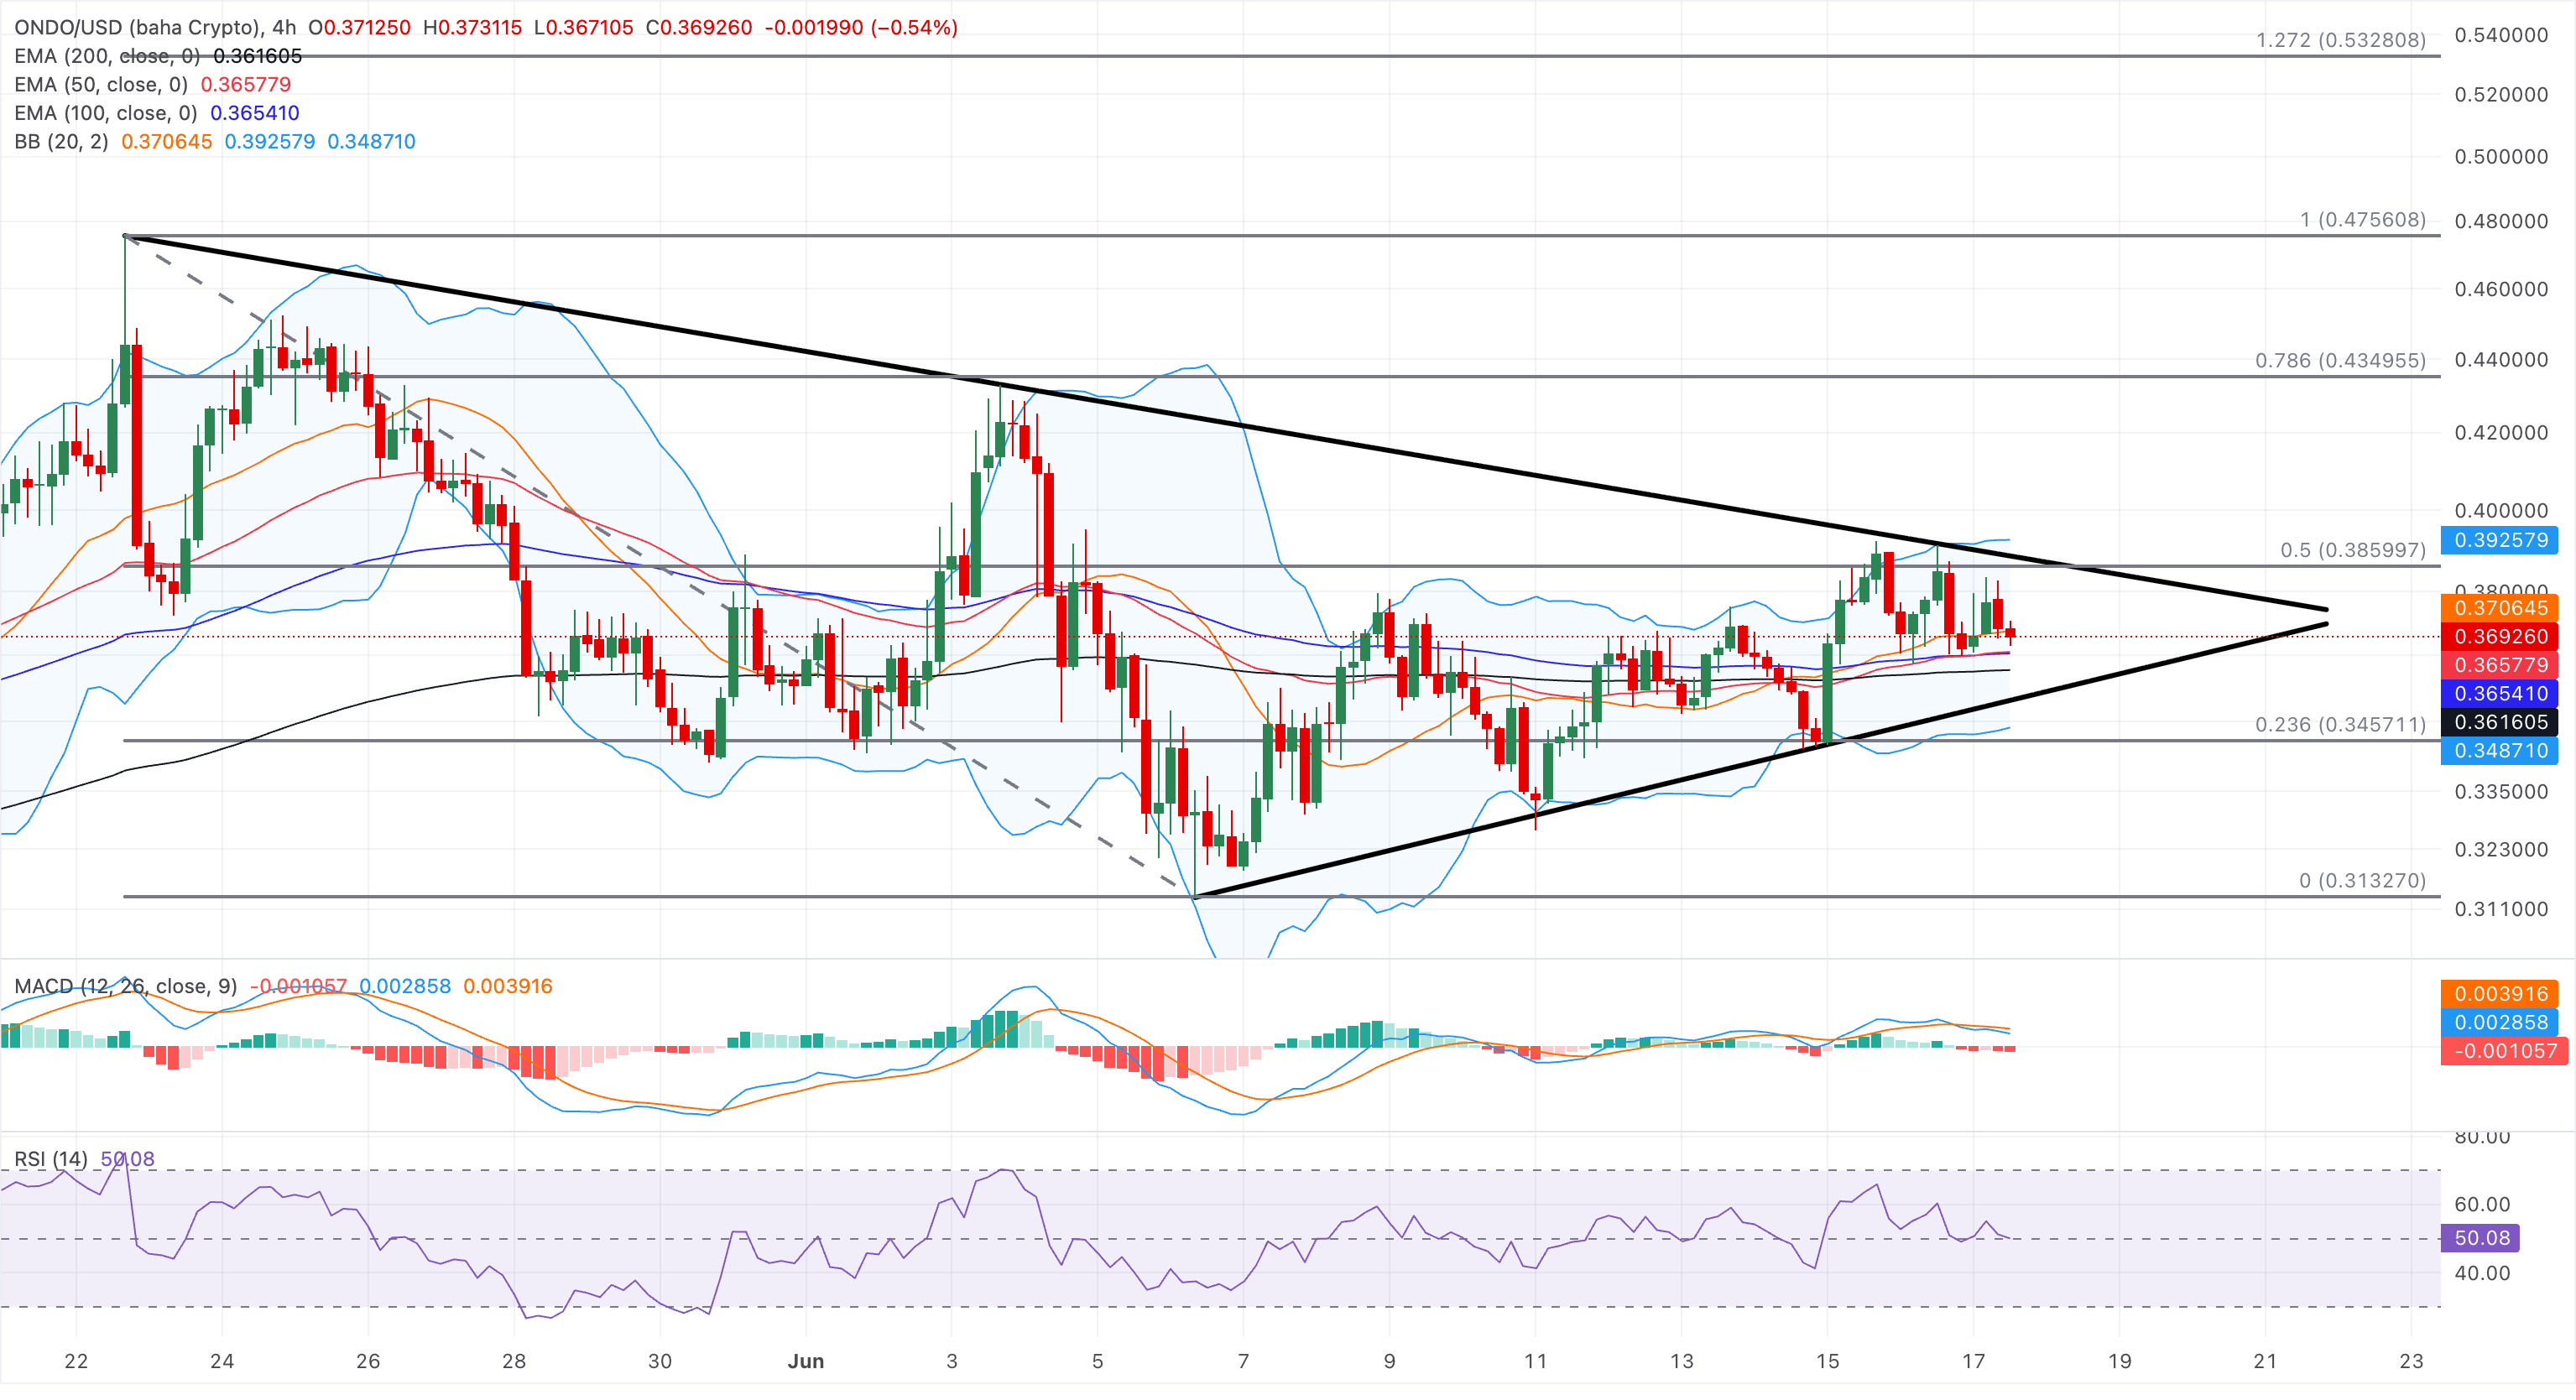
On the topside, initial resistance emerges at the Bollinger middle band around $0.3705, followed by the 50% retracement at $0.3859, close to the descending trendline barrier. Above this, the 78.6% Fibonacci retracement level at $0.4349 would be the next hurdle if buyers regain control.
(The technical analysis of this story was written with the help of an AI tool.)
Author

Vishal Dixit
FXStreet
Vishal Dixit holds a B.Sc. in Chemistry from Wilson College but found his true calling in the world of crypto.



