Monero Price Forecast: XMR eyes wedge breakout rally amid Qubic hashrate dominance
- Monero edges higher for the third consecutive day, aiming to surpass the 200–day EMA.
- Qubic, a mining platform, has crossed 51% hashrate, controlling more than half of the network’s computing power.
- The technical outlook maintains a bullish bias as price action forms a falling wedge pattern.

Monero (XMR) trades in the green at press time on Monday, marking its third consecutive day of uptrend. The privacy coin aims to reclaim its 200-day Exponential Moving Average (EMA), backed by increased demand from Qubic, which now controls over 51% of the Monero hashrate. Kraken has re-enabled XMR deposits, which now require 720 confirmations before being credited.
Still, the technical outlook maintains a bullish bias amid network outrage as price action forms a falling wedge pattern, generally known for upside breaks.
Kraken takes cautionary measures as Qubic dominates the Monero network
Qubic Protocol achieved its target of controlling 51% of Monero's hashrate on August 11. Hashrate refers to the total mining power of the network.
With the newfound dominance, Qubic now holds transaction control, censorship powers, and block monopoly over Monero. Still, the Qubic team has decided not to overtake protocol's consensus for now, which will be decided after internal discussions.
Kraken, a crypto exchange, had paused XMR deposits as Qubic’s 51% attack involved the risk of a sudden price shift. The exchange has re-enabled the deposits, which now require 720 confirmations before being credited.
Monero’s bounce back eyes a wedge breakout rally
Monero edges closer to the 200-day EMA at $275 with a bounce back within a falling wedge pattern on the daily chart (shared below). The recovery run in XMR forms two consecutive bullish engulfing candles, extending the uptrend by nearly 1% at the time of writing on Monday.
A clean push above the 200-day EMA could extend the XMR recovery to the overhead resistance trendline at $290.
The Relative Strength Index (RSI) is at 45 on the daily chart, approaching the halfway line as it reverses from the oversold zone. This sudden rise in RSI indicates increased buying pressure.
The Moving Average Convergence Divergence (MACD) line crosses above its signal line, signaling a bullish turnaround. A decisive green histogram bar forming above the zero line would signal a resurgence of bullish momentum.
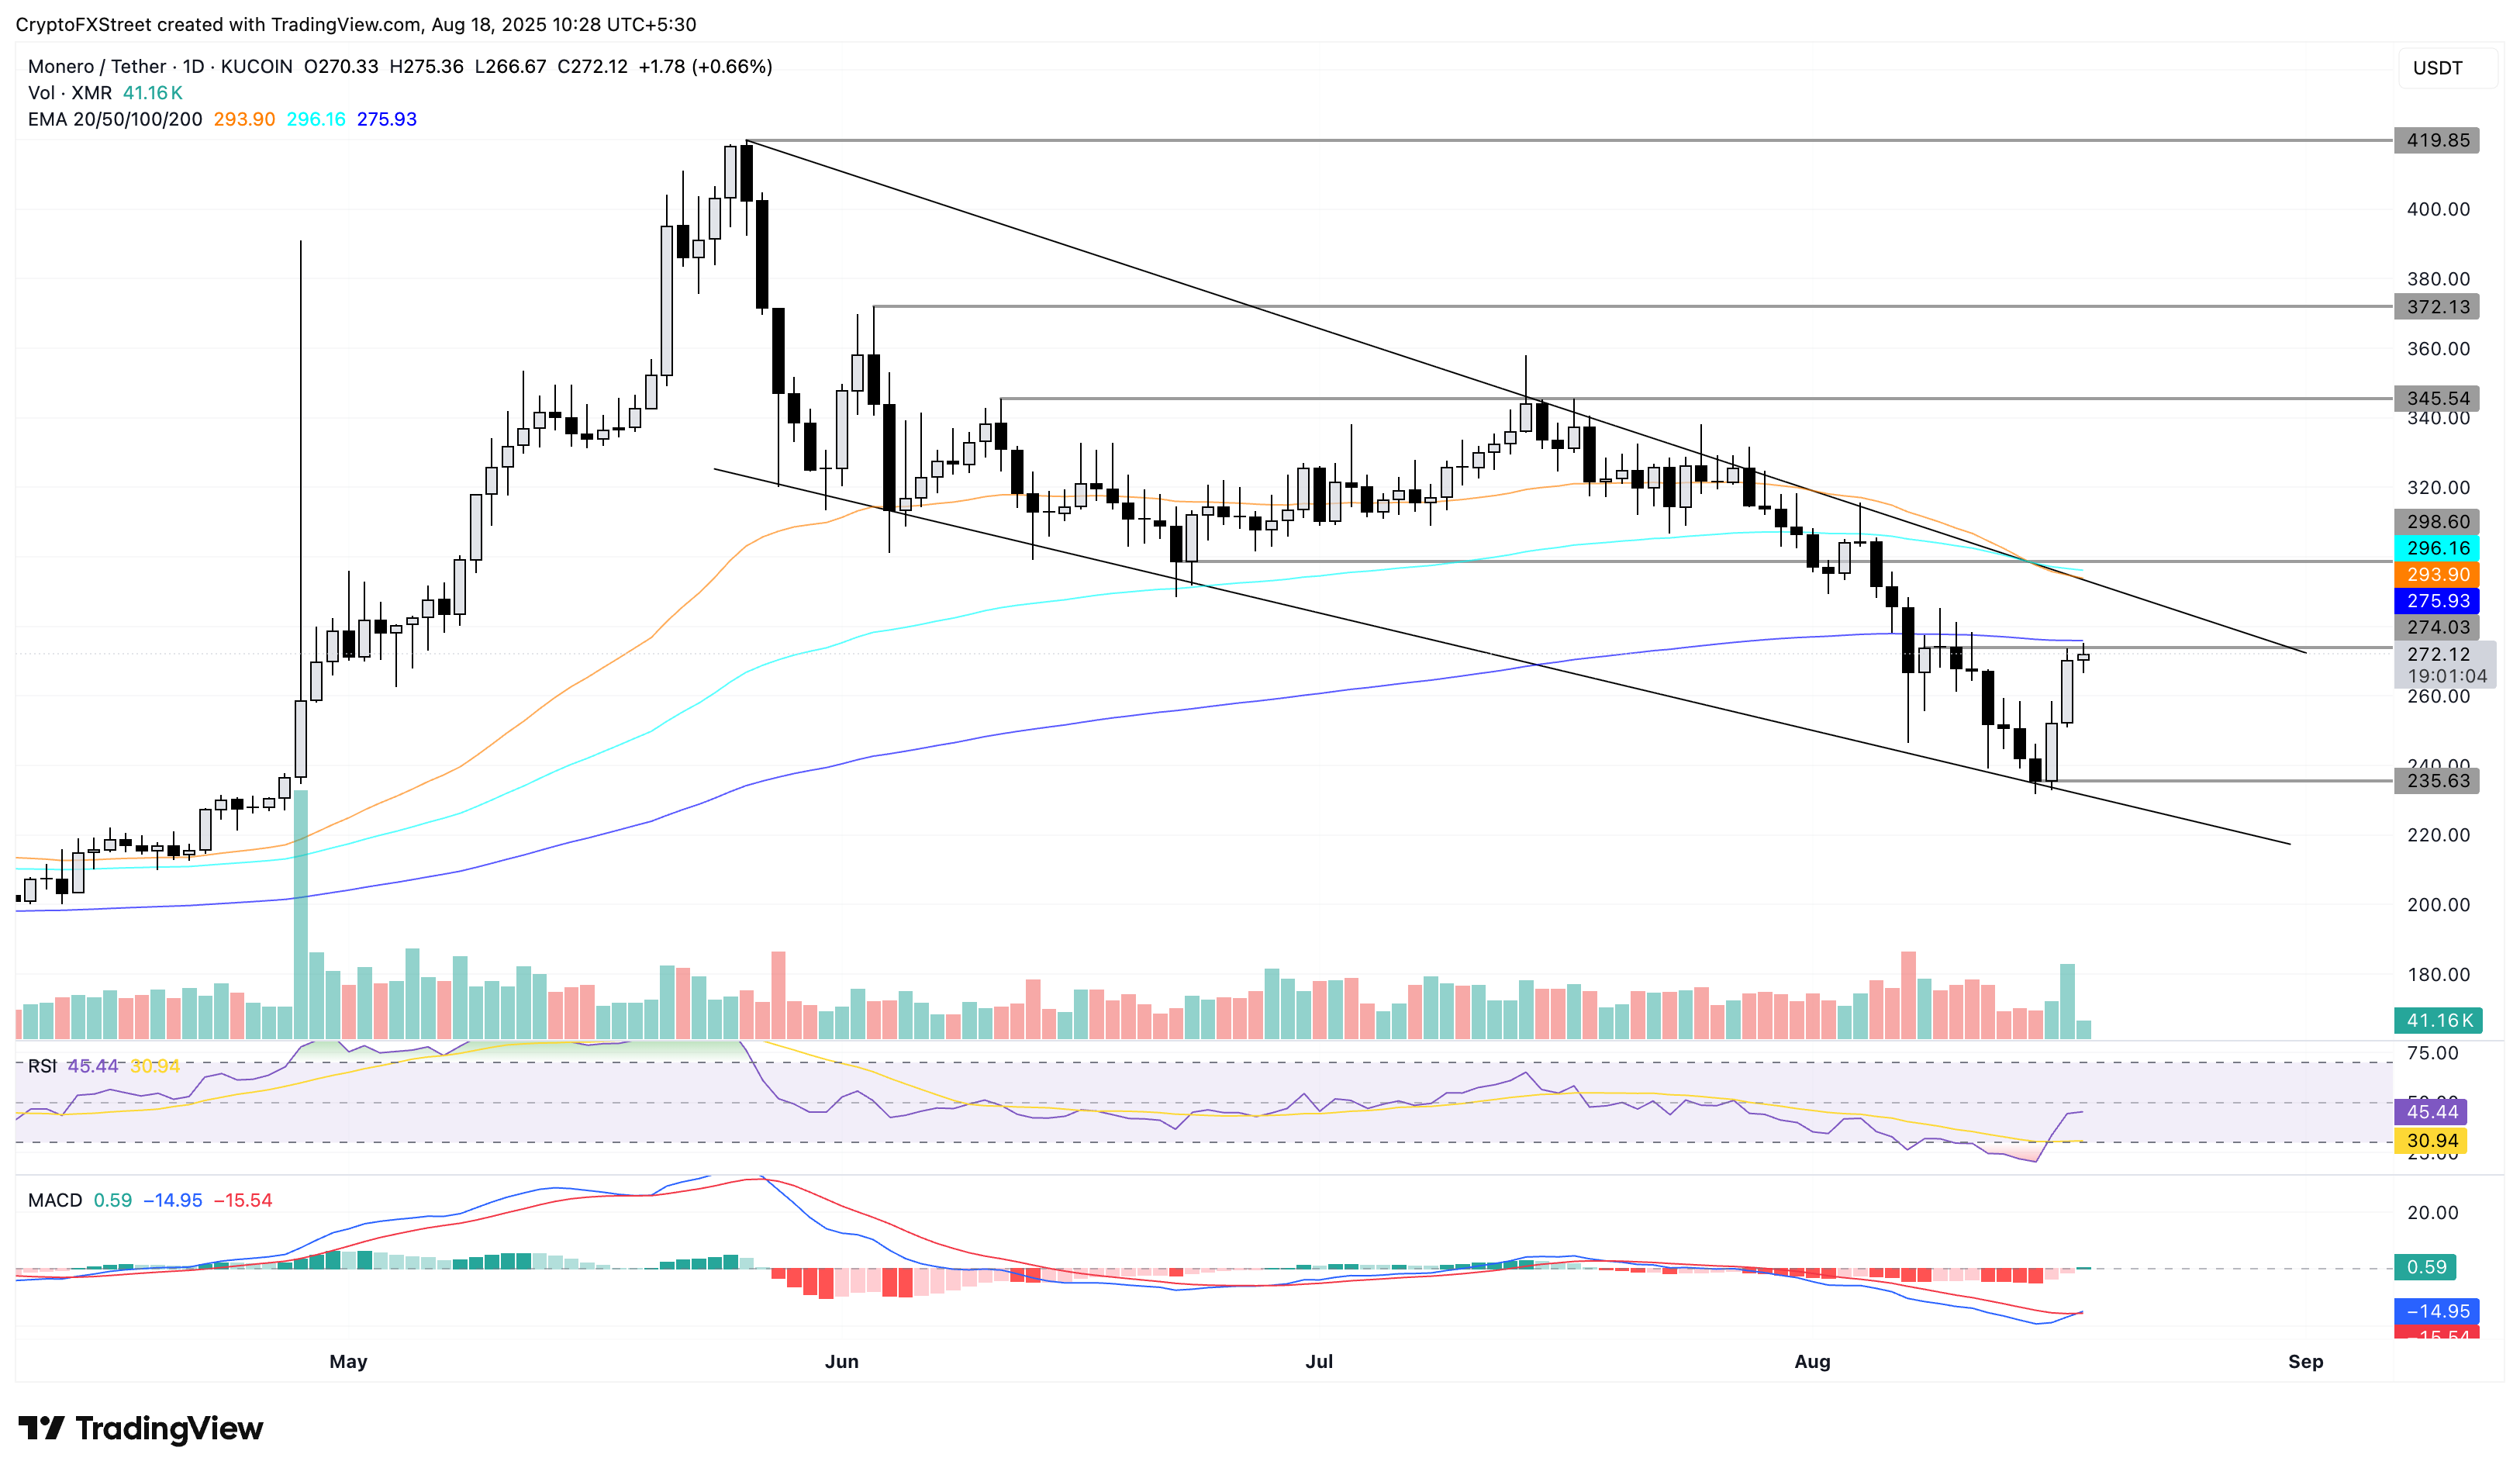
XMR/USDT daily price chart.
Looking down, a bullish failure to cross the 200-day EMA could retest the Friday close at $235.
Author

Vishal Dixit
FXStreet
Vishal Dixit holds a B.Sc. in Chemistry from Wilson College but found his true calling in the world of crypto.


