Meme coins to watch: WIF, SPX, and APE show bullish potential
- WIF survives last week's fall to hold an uptrend with a 12% surge so far in June.
- SPX6900 maintains a strong start on Wednesday following a golden crossover on Sunday.
- Apecoin regains bullish momentum, aiming to surpass critical dynamic resistance to reclaim $1.

Dogwifhat (WIF), SPX6900 (SPX), and Apecoin (APX) are the select meme coins in the green on Wednesday with a bullish trend so far this week. The technical outlook of WIF, SPX, and APE suggests a potential breakout rally to shape a bullish week.
Dogwifhat aims to surpass the 200-day EMA
WIF trades at $0.978 at the time of writing on Wednesday, printing a potential Doji candle in the daily chart after three consecutive bullish candles, resulting in over a 23% surge from the low at $0.786 on Saturday.
The meme coin is in an uptrend as it formed a local bottom above the Supertrend indicator line at $0.780. Notably, the 50-day and 100-day Exponential Moving Averages (EMAs) near $0.860 held the previous week's close above dynamic support levels.
With the recovery in action this week, the Moving Average Convergence/Divergence (MACD) indicator nears the signal line, hinting at a positive crossover that could signal a bullish reversal.
The 200-day EMA overlaps with the 50% Fibonacci retracement level at $1.147, drawn from November’s swing high at $4.163 to April’s lowest closing price at $0.316. A potential breakout above $1.147 could prolong the uptrend to the 78.6% Fibonacci retracement level at $2.398.
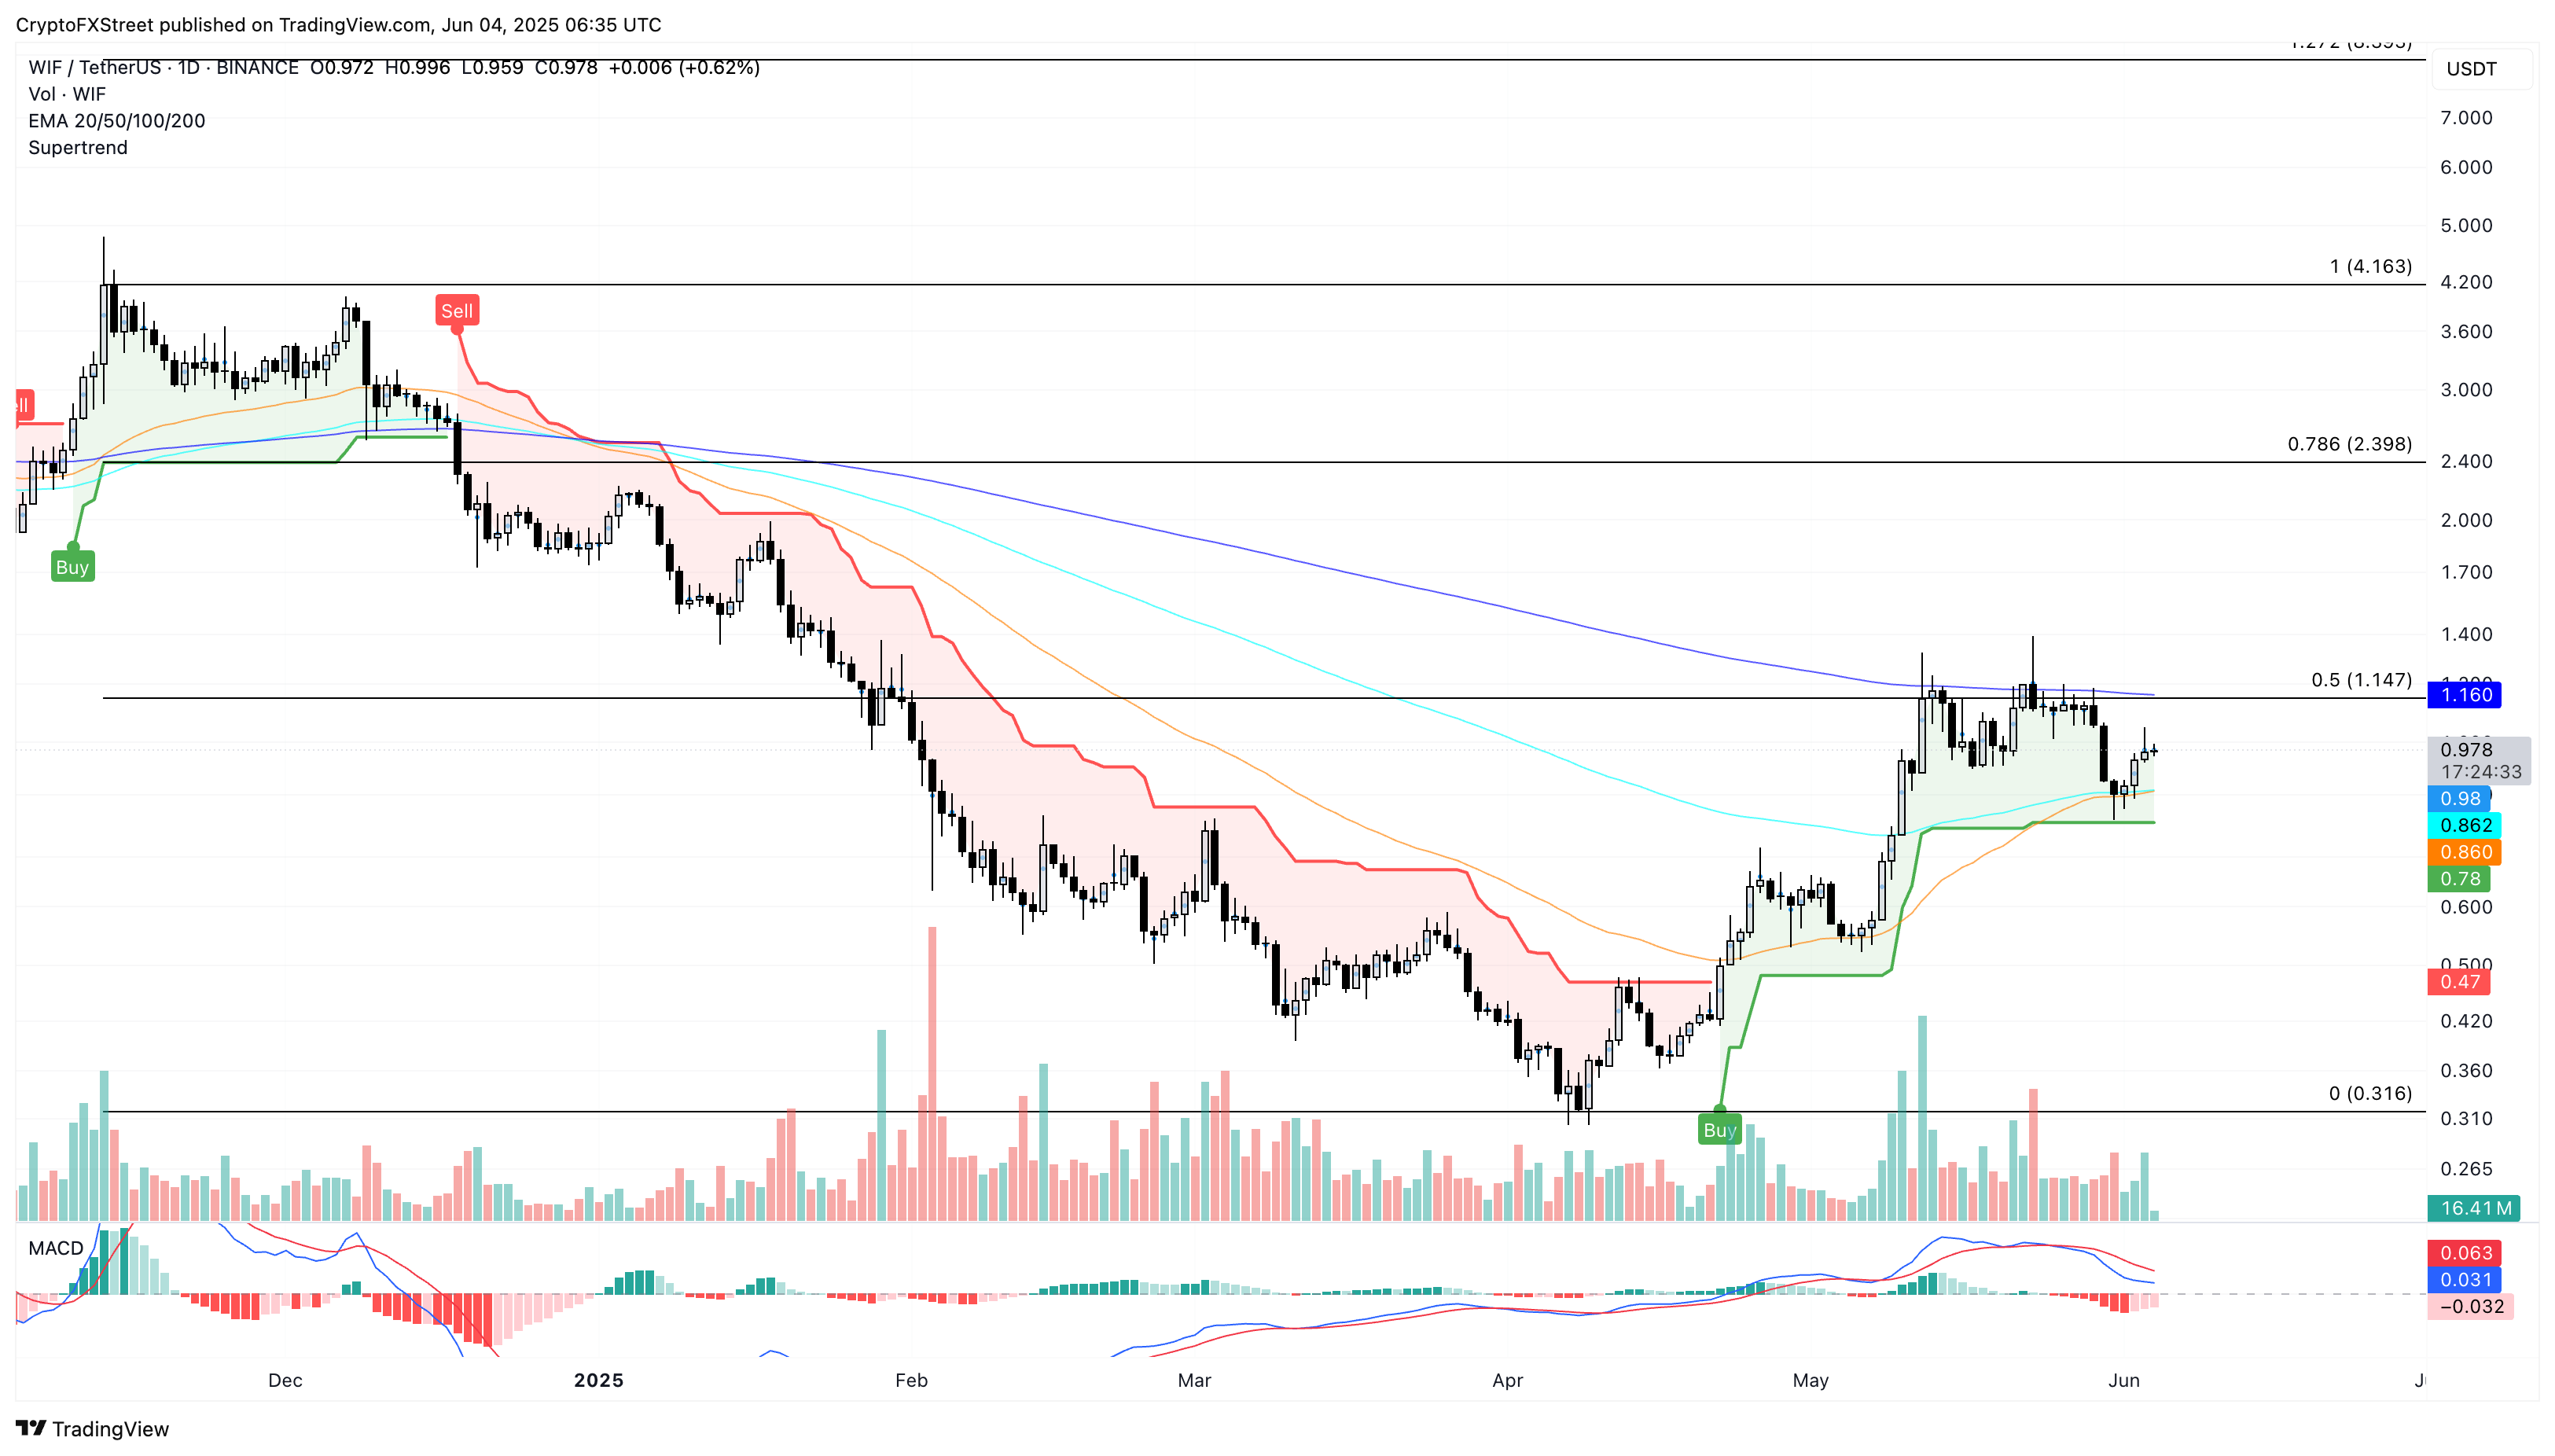
WIF/USDT daily price chart. Source: Tradingview
On the flip side, a potential reversal could result in a decline to Saturday's low near the 50-day EMA at $0.860.
SPX to extend bull run
SPX meme coin trades at $1.189, with a near 9% surge at press time on Wednesday, extending the weekly gains to 15% so far. Taking off the 50% Fibonacci retracement level at $0.92, drawn between the highest January closing price at $1.553 and the March’s lowest closing price of $0.294, SPX aims to challenge the 78.6% Fibonacci level at $1.284.
With the ongoing rally, the 50-day and 200-day EMAs flashed a golden cross on Sunday, a bullish signal for price action traders. Adding to this, the 100-day and 200-day EMAs are closing towards a bullish crossover, to reinstate a complete uptrend in motion.
However, the rising SPX price fails to reflect a momentum surge as the RSI line at 69 hovers almost flat near the overbought boundary line. This indicates a bearish divergence between the price and the RSI, hinting at a potential pullback during the uptrend.
If SPX closes above $1.284 on a daily basis, it could undermine the RSI bearish divergence, and the price could rise to $1.553.
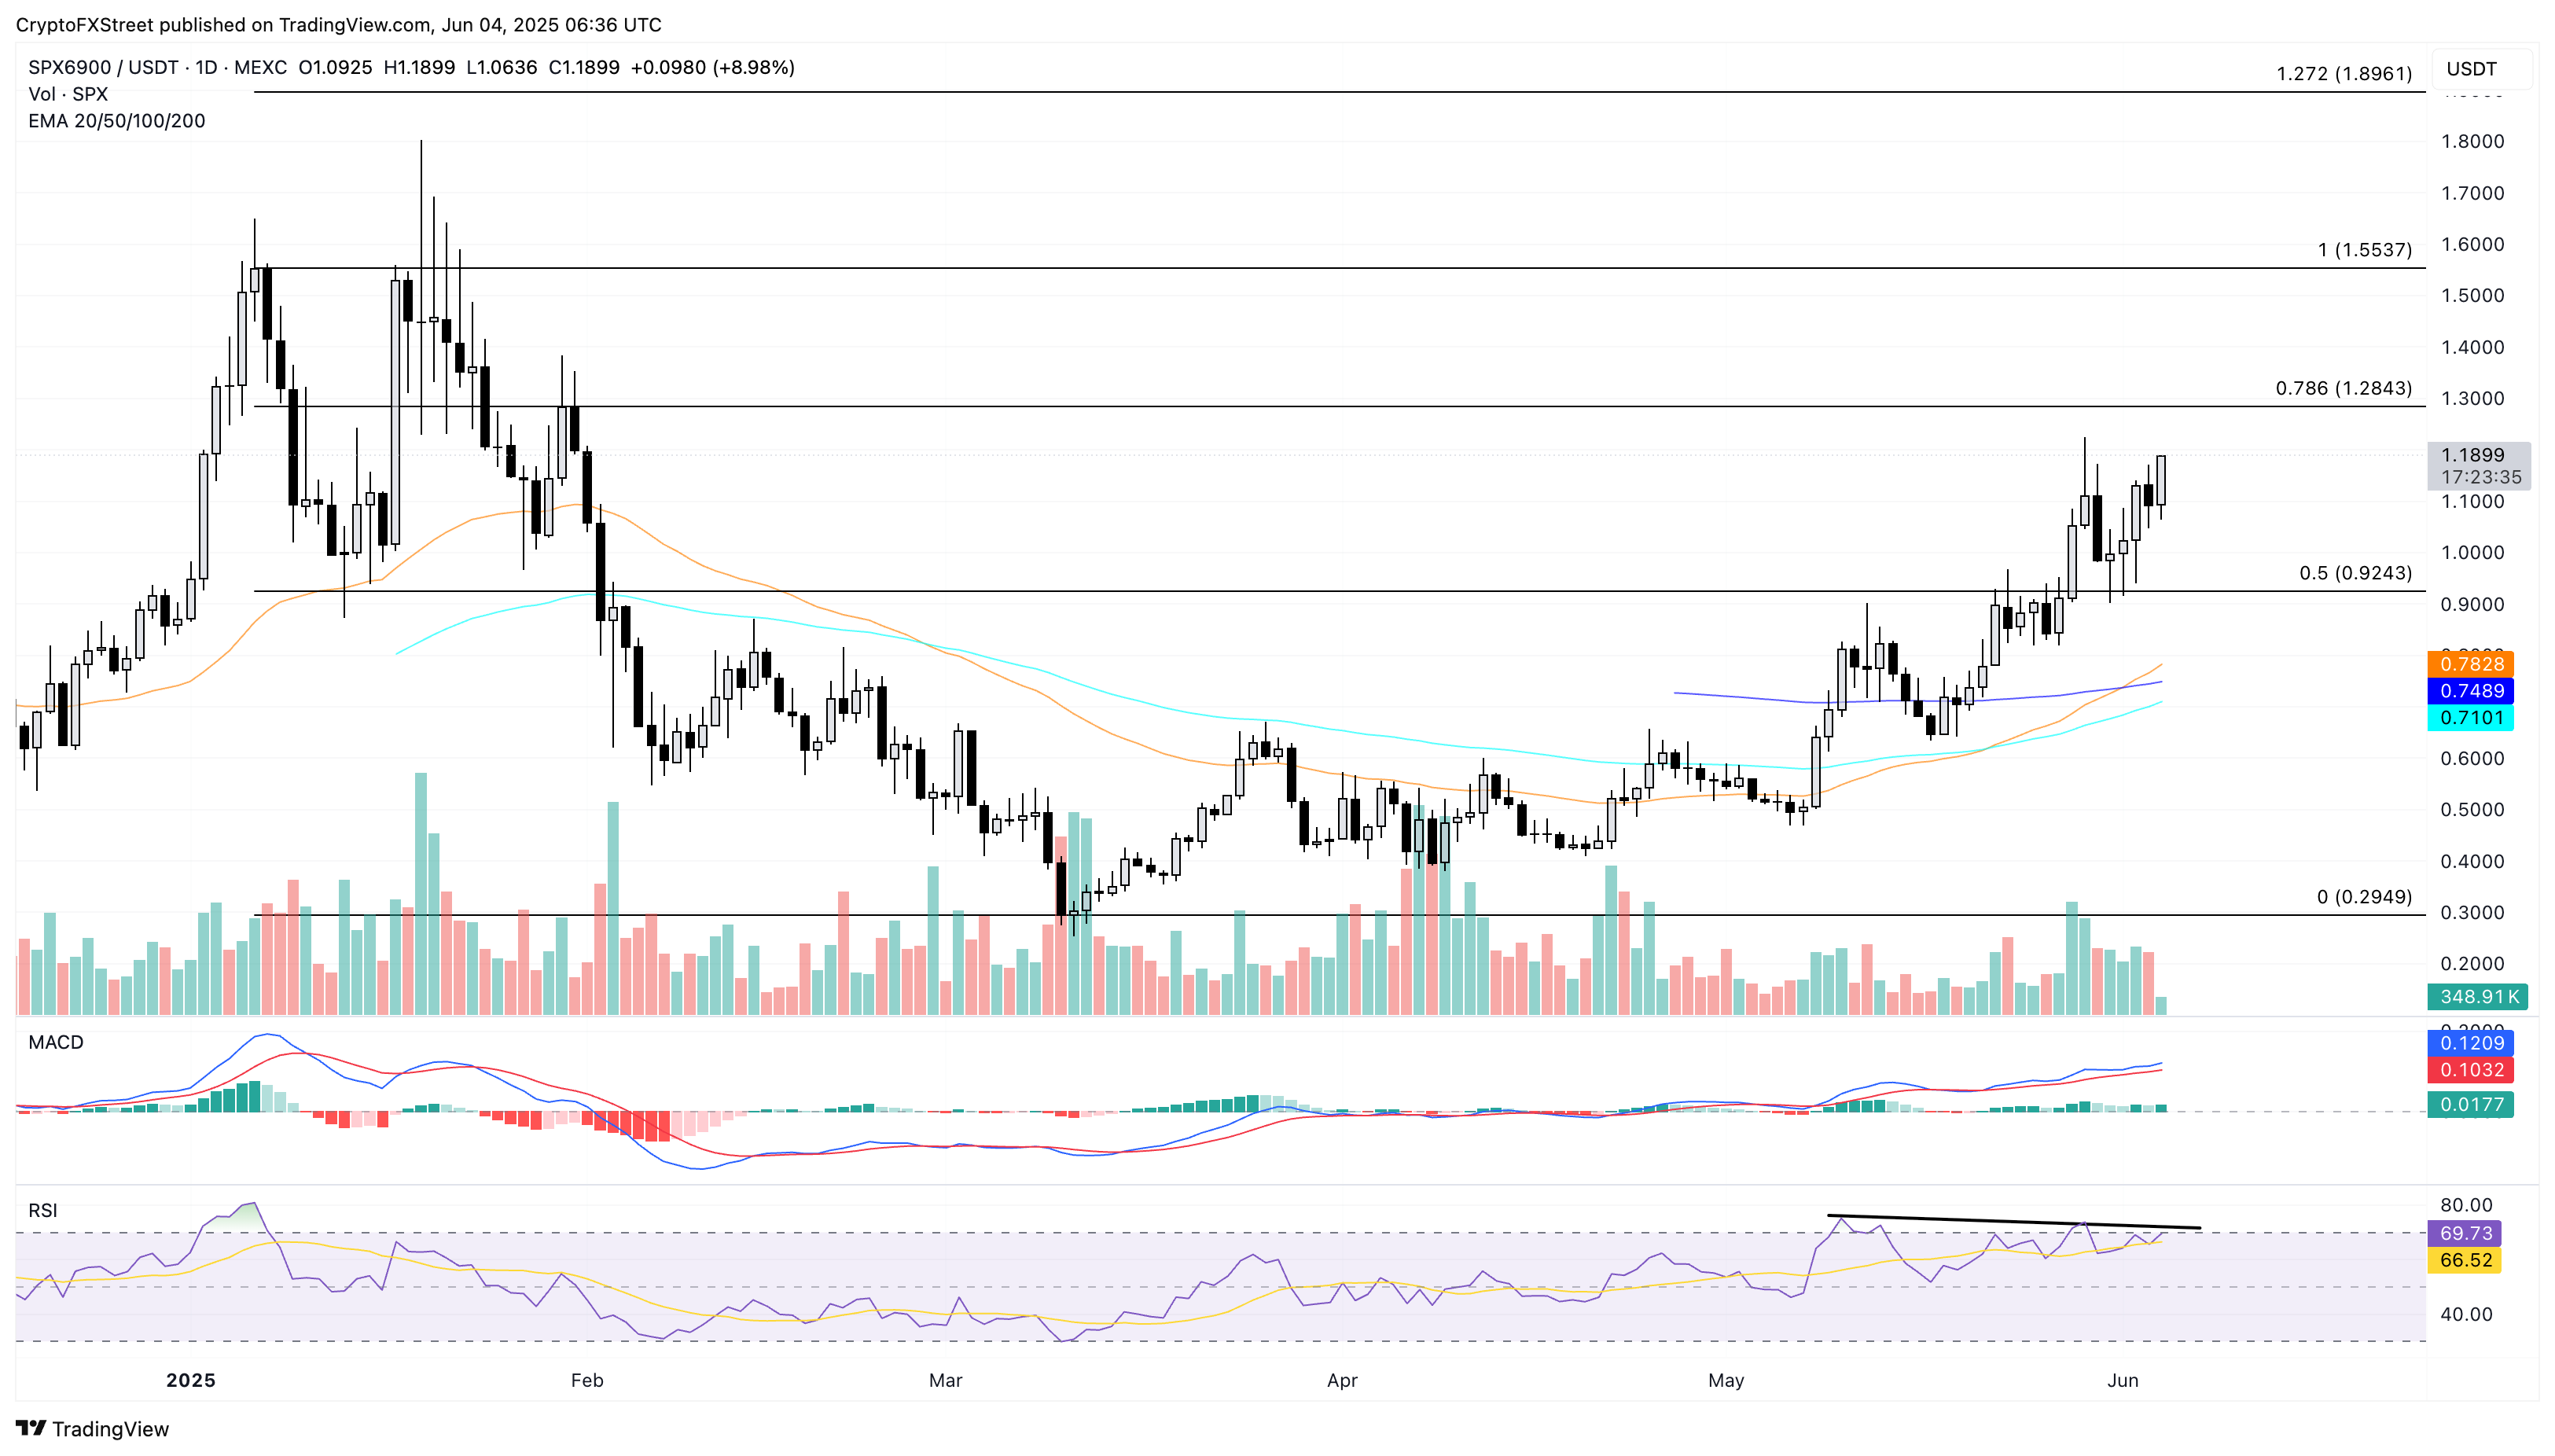
SPX/USDT daily price chart. Source: Tradingview
Conversely, a reversal from $1.284 could result in a steep decline to the 50% Fibonacci retracement level at $0.924.
Apecoin nears the 200-day EMA breakout to reach $1.16
APE is up nearly 14% in the day at press time, signaling a range breakout formed between the 200-day EMA at $0.7379 and the 100-day EMA at $0.6325. The 23.60% Fibonacci retracement level aligns with the 200-day EMA, drawn from $1.9450 on December 4 to $0.3769 on April 8.
To mark a decisive breakout, the meme coin must sustain a closing price above the breached levels. This could result in a price surge to the 50% Fibonacci retracement level at $1.1610. Investors could anticipate a minor hurdle near the $1 psychological mark.
The MACD and its signal line mark a bullish crossover, while the RSI line shows a spike to 64, indicating room for growth. As the momentum indicators suggest a surge in buying pressure, investors could witness a sharp rally upon breakout.
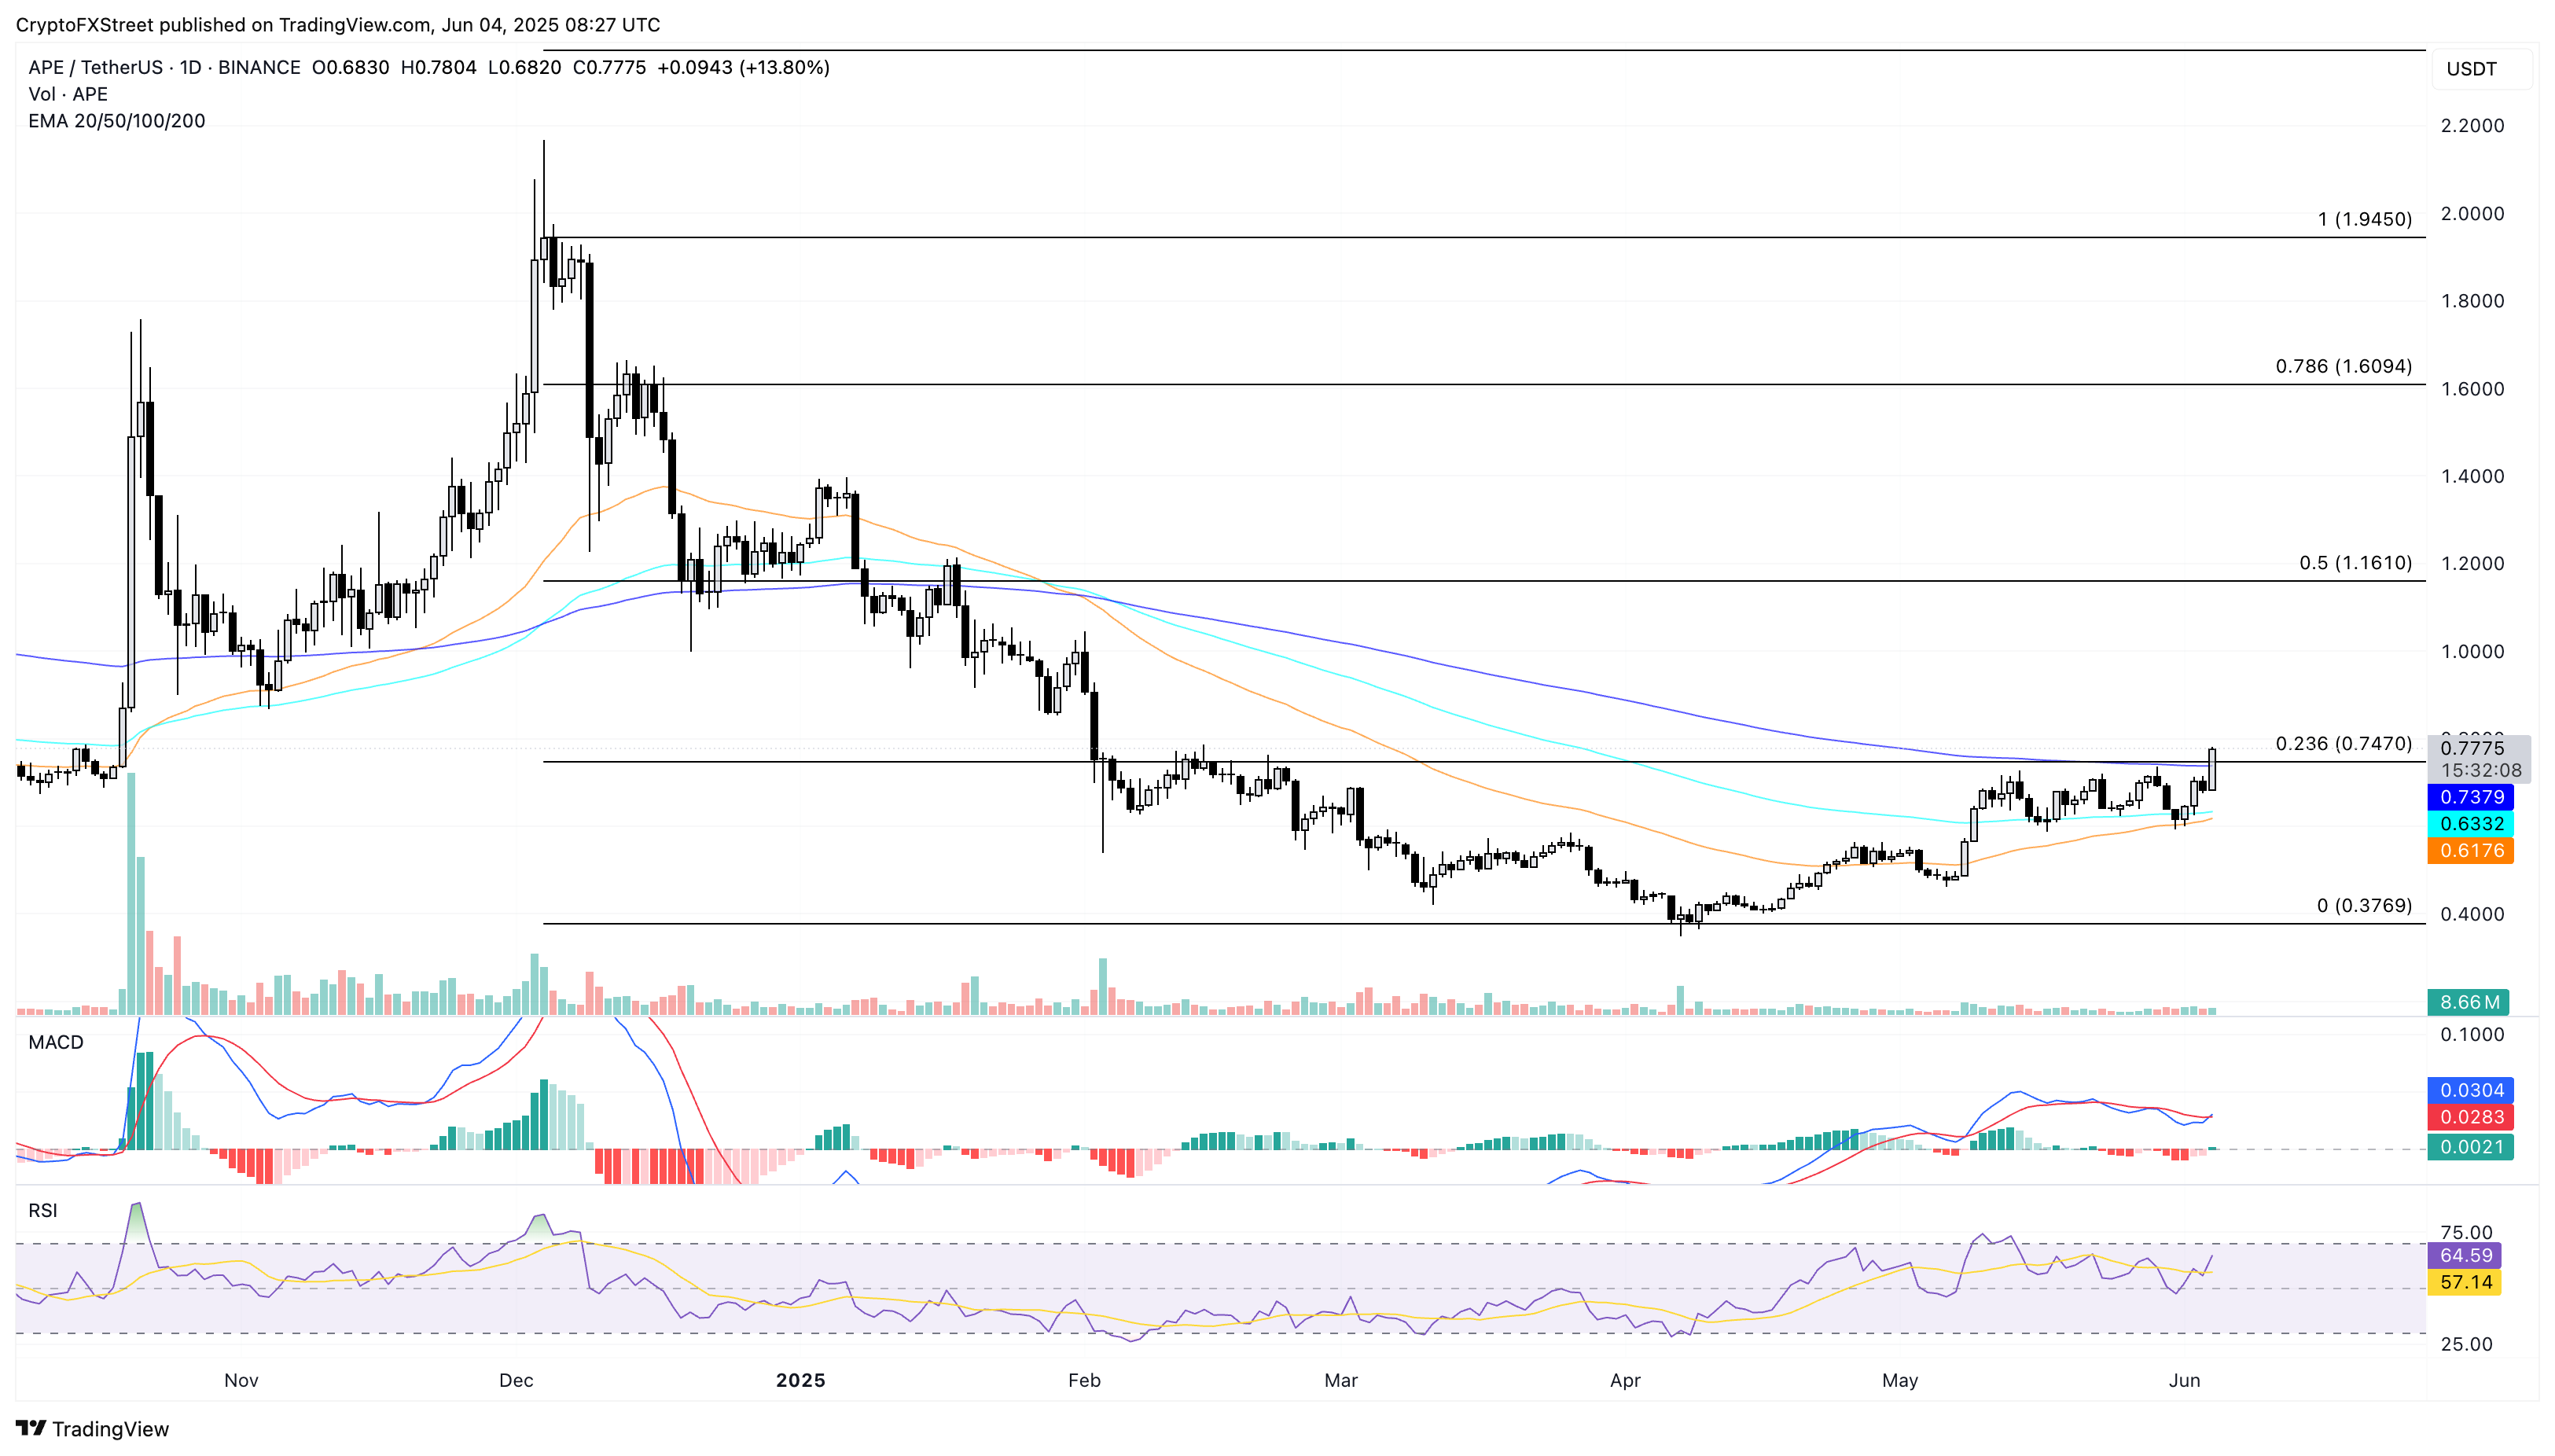
APE/USDT daily price chart. Source: Tradingview
Conversely, a failure to hold prices above the 200-day EMA could result in a retest of the 50-day EMA at $0.6176.
Author

Vishal Dixit
FXStreet
Vishal Dixit holds a B.Sc. in Chemistry from Wilson College but found his true calling in the world of crypto.


