Meme Coins Price Prediction: Dogecoin forms Golden Cross as Shiba Inu, Pepe test EMAs
- Dogecoin holds above $0.2500 as crucial moving averages develop bullish Golden Cross pattern.
- Shiba Inu range breakout rally reverses to test the 100-period EMA.
- Pepe’s bounce back faces opposition at the 50-day EMA.

Meme coins, such as Dogecoin (DOGE), Shiba Inu (SHIB), and Pepe (PEPE), are taking a breather after two days of recovery. The derivatives data indicate elevated retail interest amid the general anticipation of a crypto market rally in October.
Interest in meme coins is on the rise
Meme coins are experiencing a renewed interest from derivative traders over the last 24 hours. Futures traders are acquiring more positions, according to CoinGlass data concerning the meme coins' Open Interest (OI). A 4% rise in the Dogecoin and Pepe OI has led them to reach $4.61 billion and $639.50 million in the last 24 hours, respectively. Meanwhile, the Shiba Inu OI remains steady at $202.55 million.
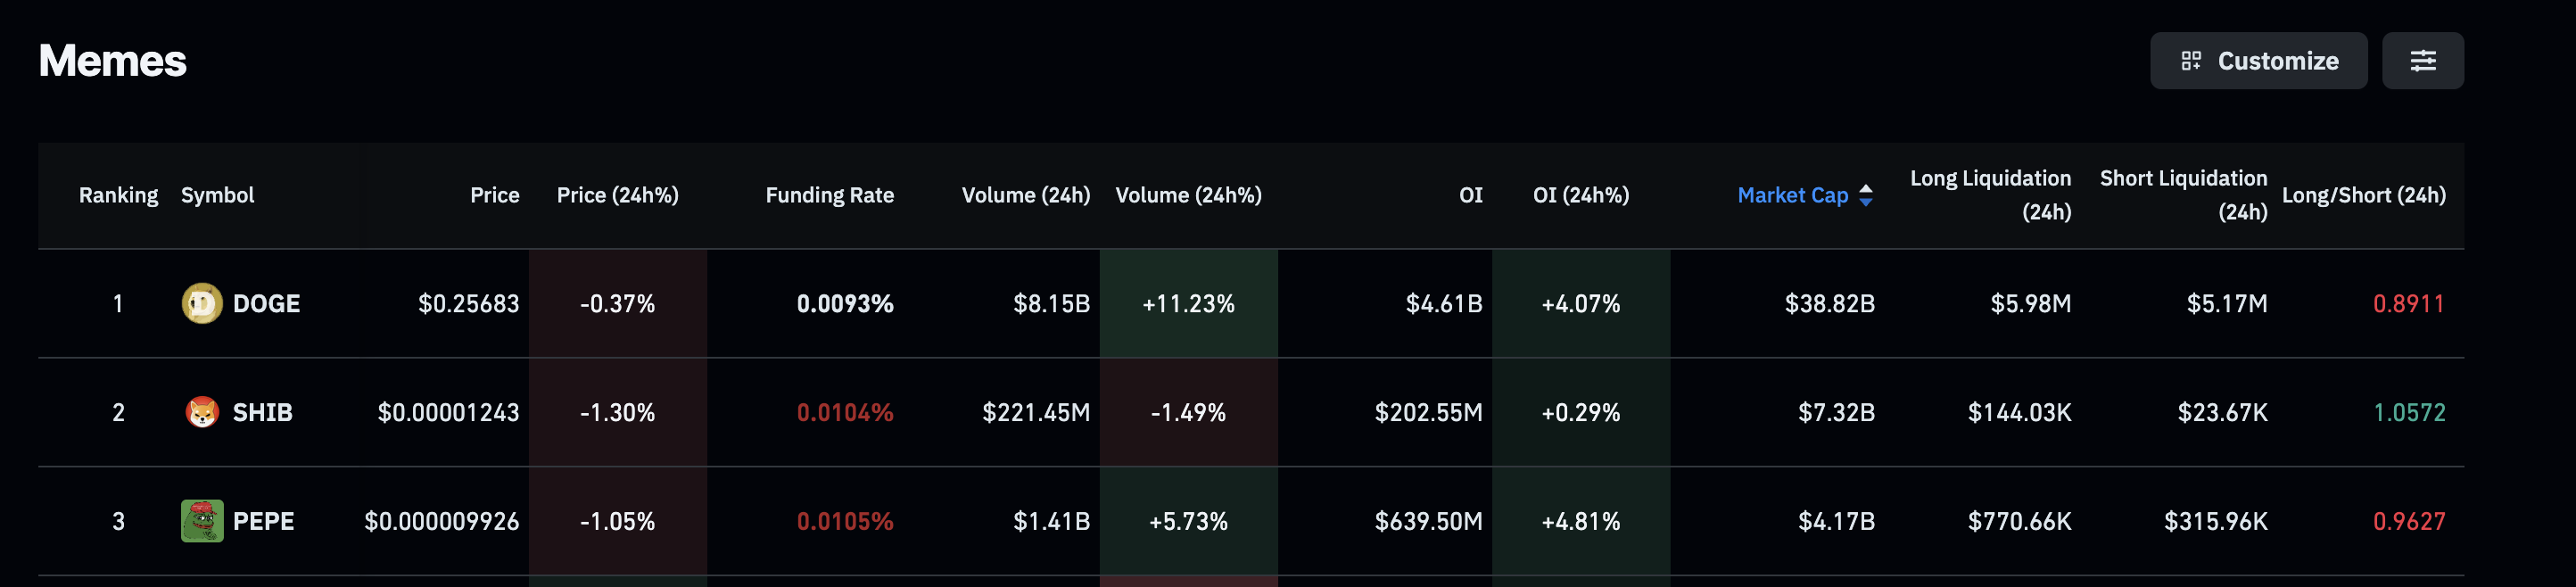
Meme coins derivatives data. Source: CoinGlass
Dogecoin rally cools off, initiates consolidation
Dogecoin edges 2% lower at press time on Friday, ticking down after two days of profit. DOGE retraces from the $0.26418 peak earlier in the day, indicating a loss in buying pressure.
The technical indicators on the 4-hour chart corroborate the slowdown in bullish momentum as the Relative Strength Index (RSI) at 65 edges lower from the overbought zone. Additionally, the Moving Average Convergence Divergence (MACD) is inching closer to its signal line, risking a potential crossover that would mark a bearish shift.
If DOGE slips under the $0.25000 psychological mark, it could extend the decline to the 100-period Exponential Moving Average (EMA) at $0.24423.
Still, the 50-period EMA crossing above the 200-period EMA projects a Golden Cross pattern, which indicates that the short-term recovery has outperformed the prevailing trend.
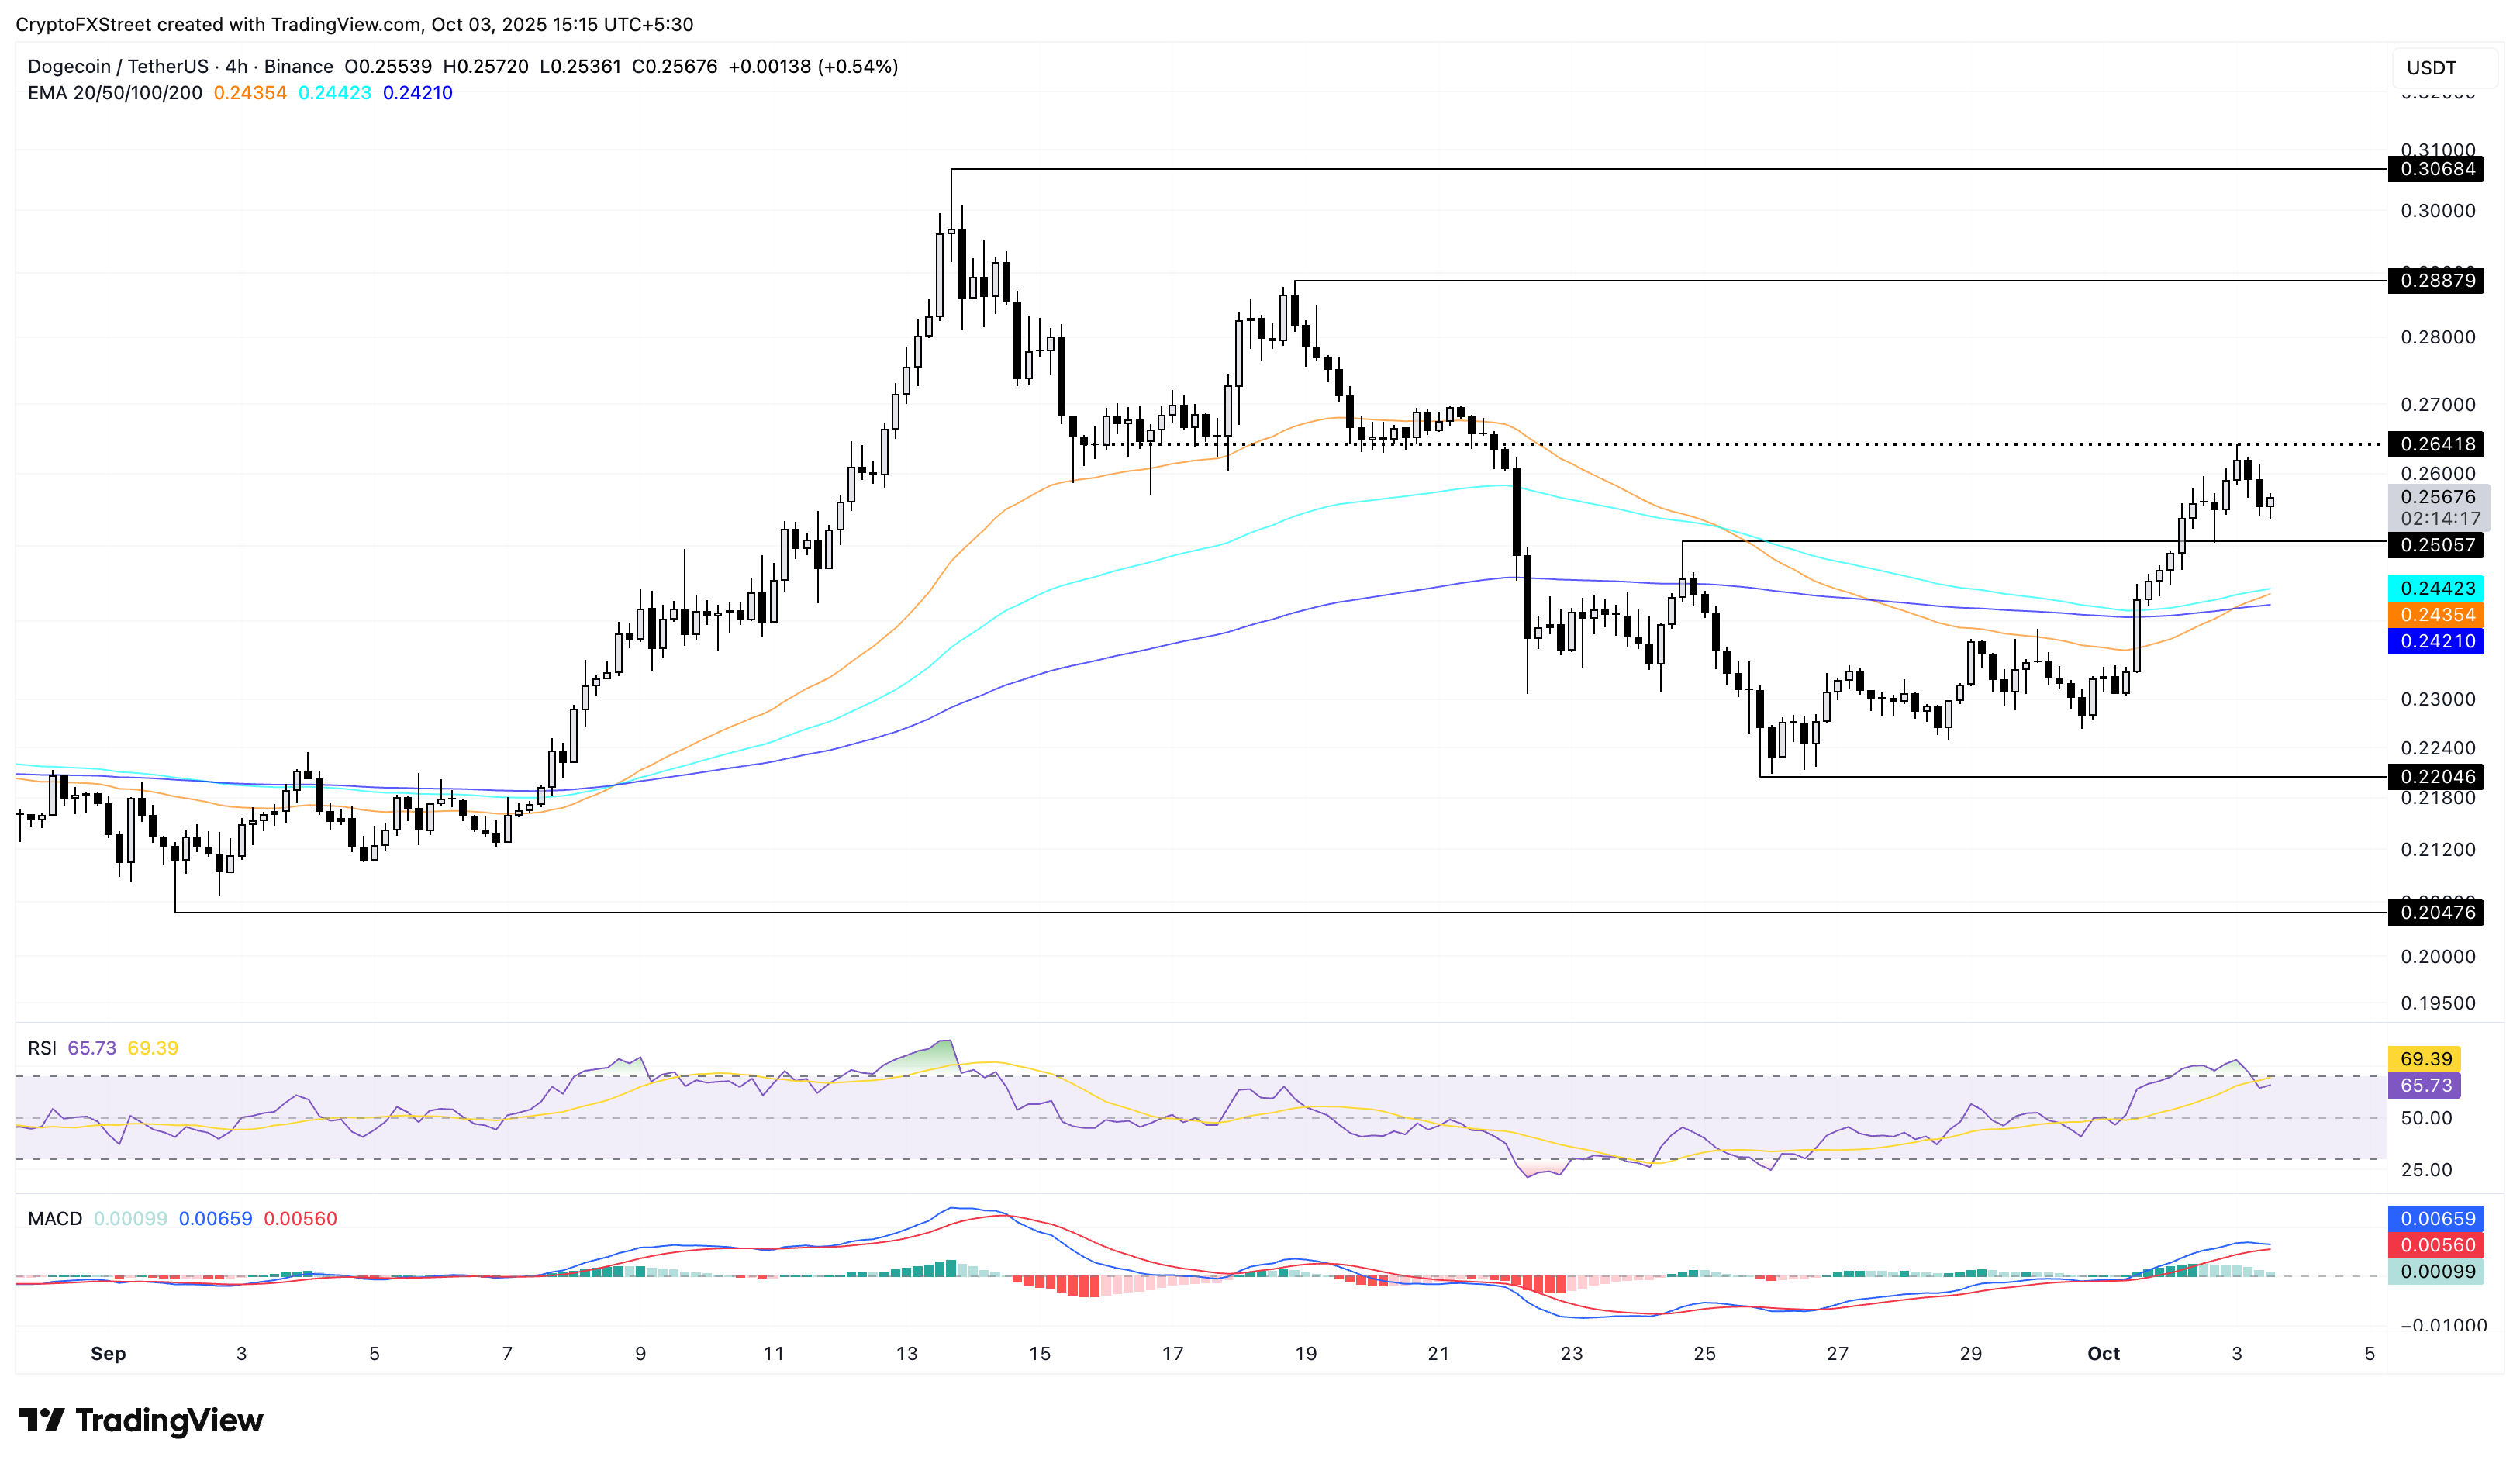
DOGE/USDT 4-hour price chart.
Looking up, if DOGE exceeds the $0.26418 mark, the meme coin could stretch the rally to Thursday’s high at $0.28879.
Shiba Inu holds at crucial support
Shiba Inu adopts a slight bearish reversal before reaching the $0.00001277 resistance level, which previously acted as a support on September 20. At the time of writing, Shiba Inu holds above the 100-period EMA on the 4-hour chart, while the 50-period and 200-period EMAs maintain a bearish alignment.
The RSI stays flat at 58 on the 4-hour chart, indicating that the buying pressure is stabilizing after a slowdown. Additionally, the MACD and signal line are on the verge of a crossover, which would signal resurfacing selling pressure.
On the downside, key areas of support for SHIB lie at the 50-period EMA at $0.00001219, followed by the $0.00001209 level, which previously acted as a resistance level of a consolidation range.
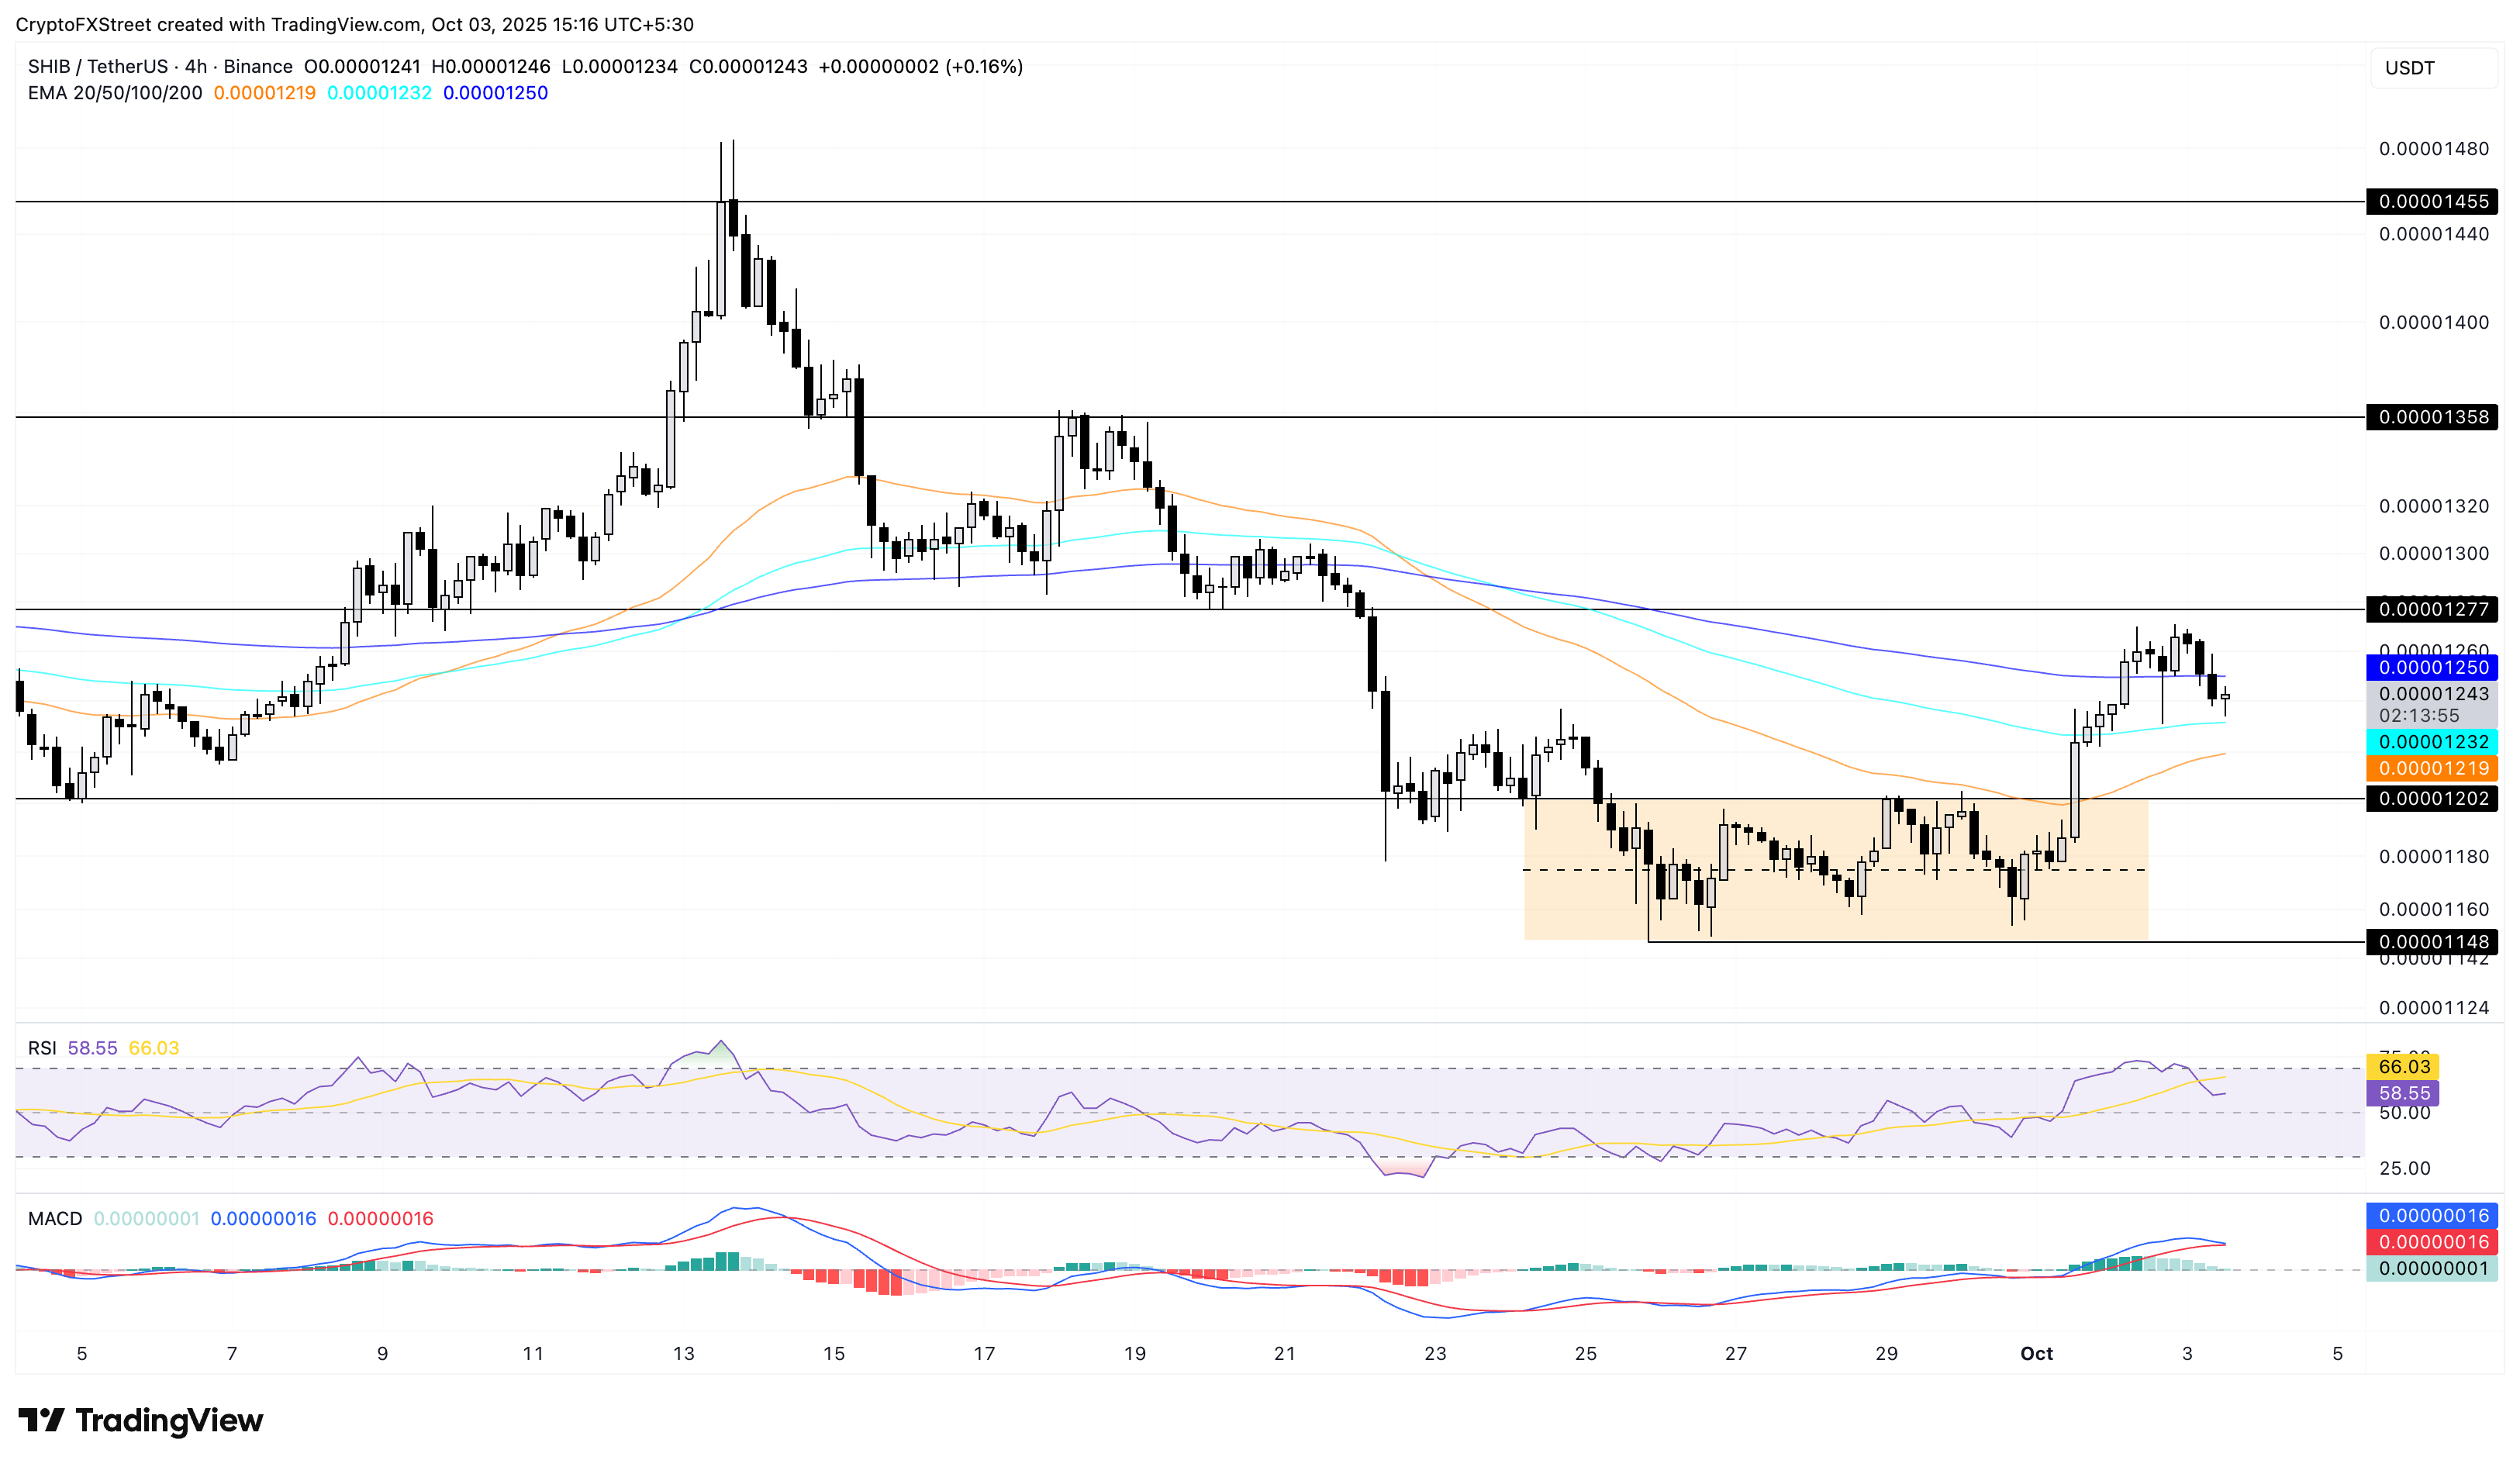
SHIB/USDT 4-hour price chart.
However, a potential recovery in SHIB surpassing the $0.00001277 level could stretch the uptrend to $0.00001358.
Pepe's recovery run faces opposition from the 50-day EMA
Pepe’s recovery run flips from the 50-day EMA at $0.00001032, resulting in a pullback of over 2% at press time on Friday. This increases the risk of a $0.00000887 retest, which has acted as a strong support level since June.
The technical indicators on the 4-hour chart indicate a gradual increase in bullish momentum as the MACD converges with its signal line, suggesting a potential crossover. Additionally, the RSI at 48 has reached neutral levels, up from the oversold zone as buying pressure increases.
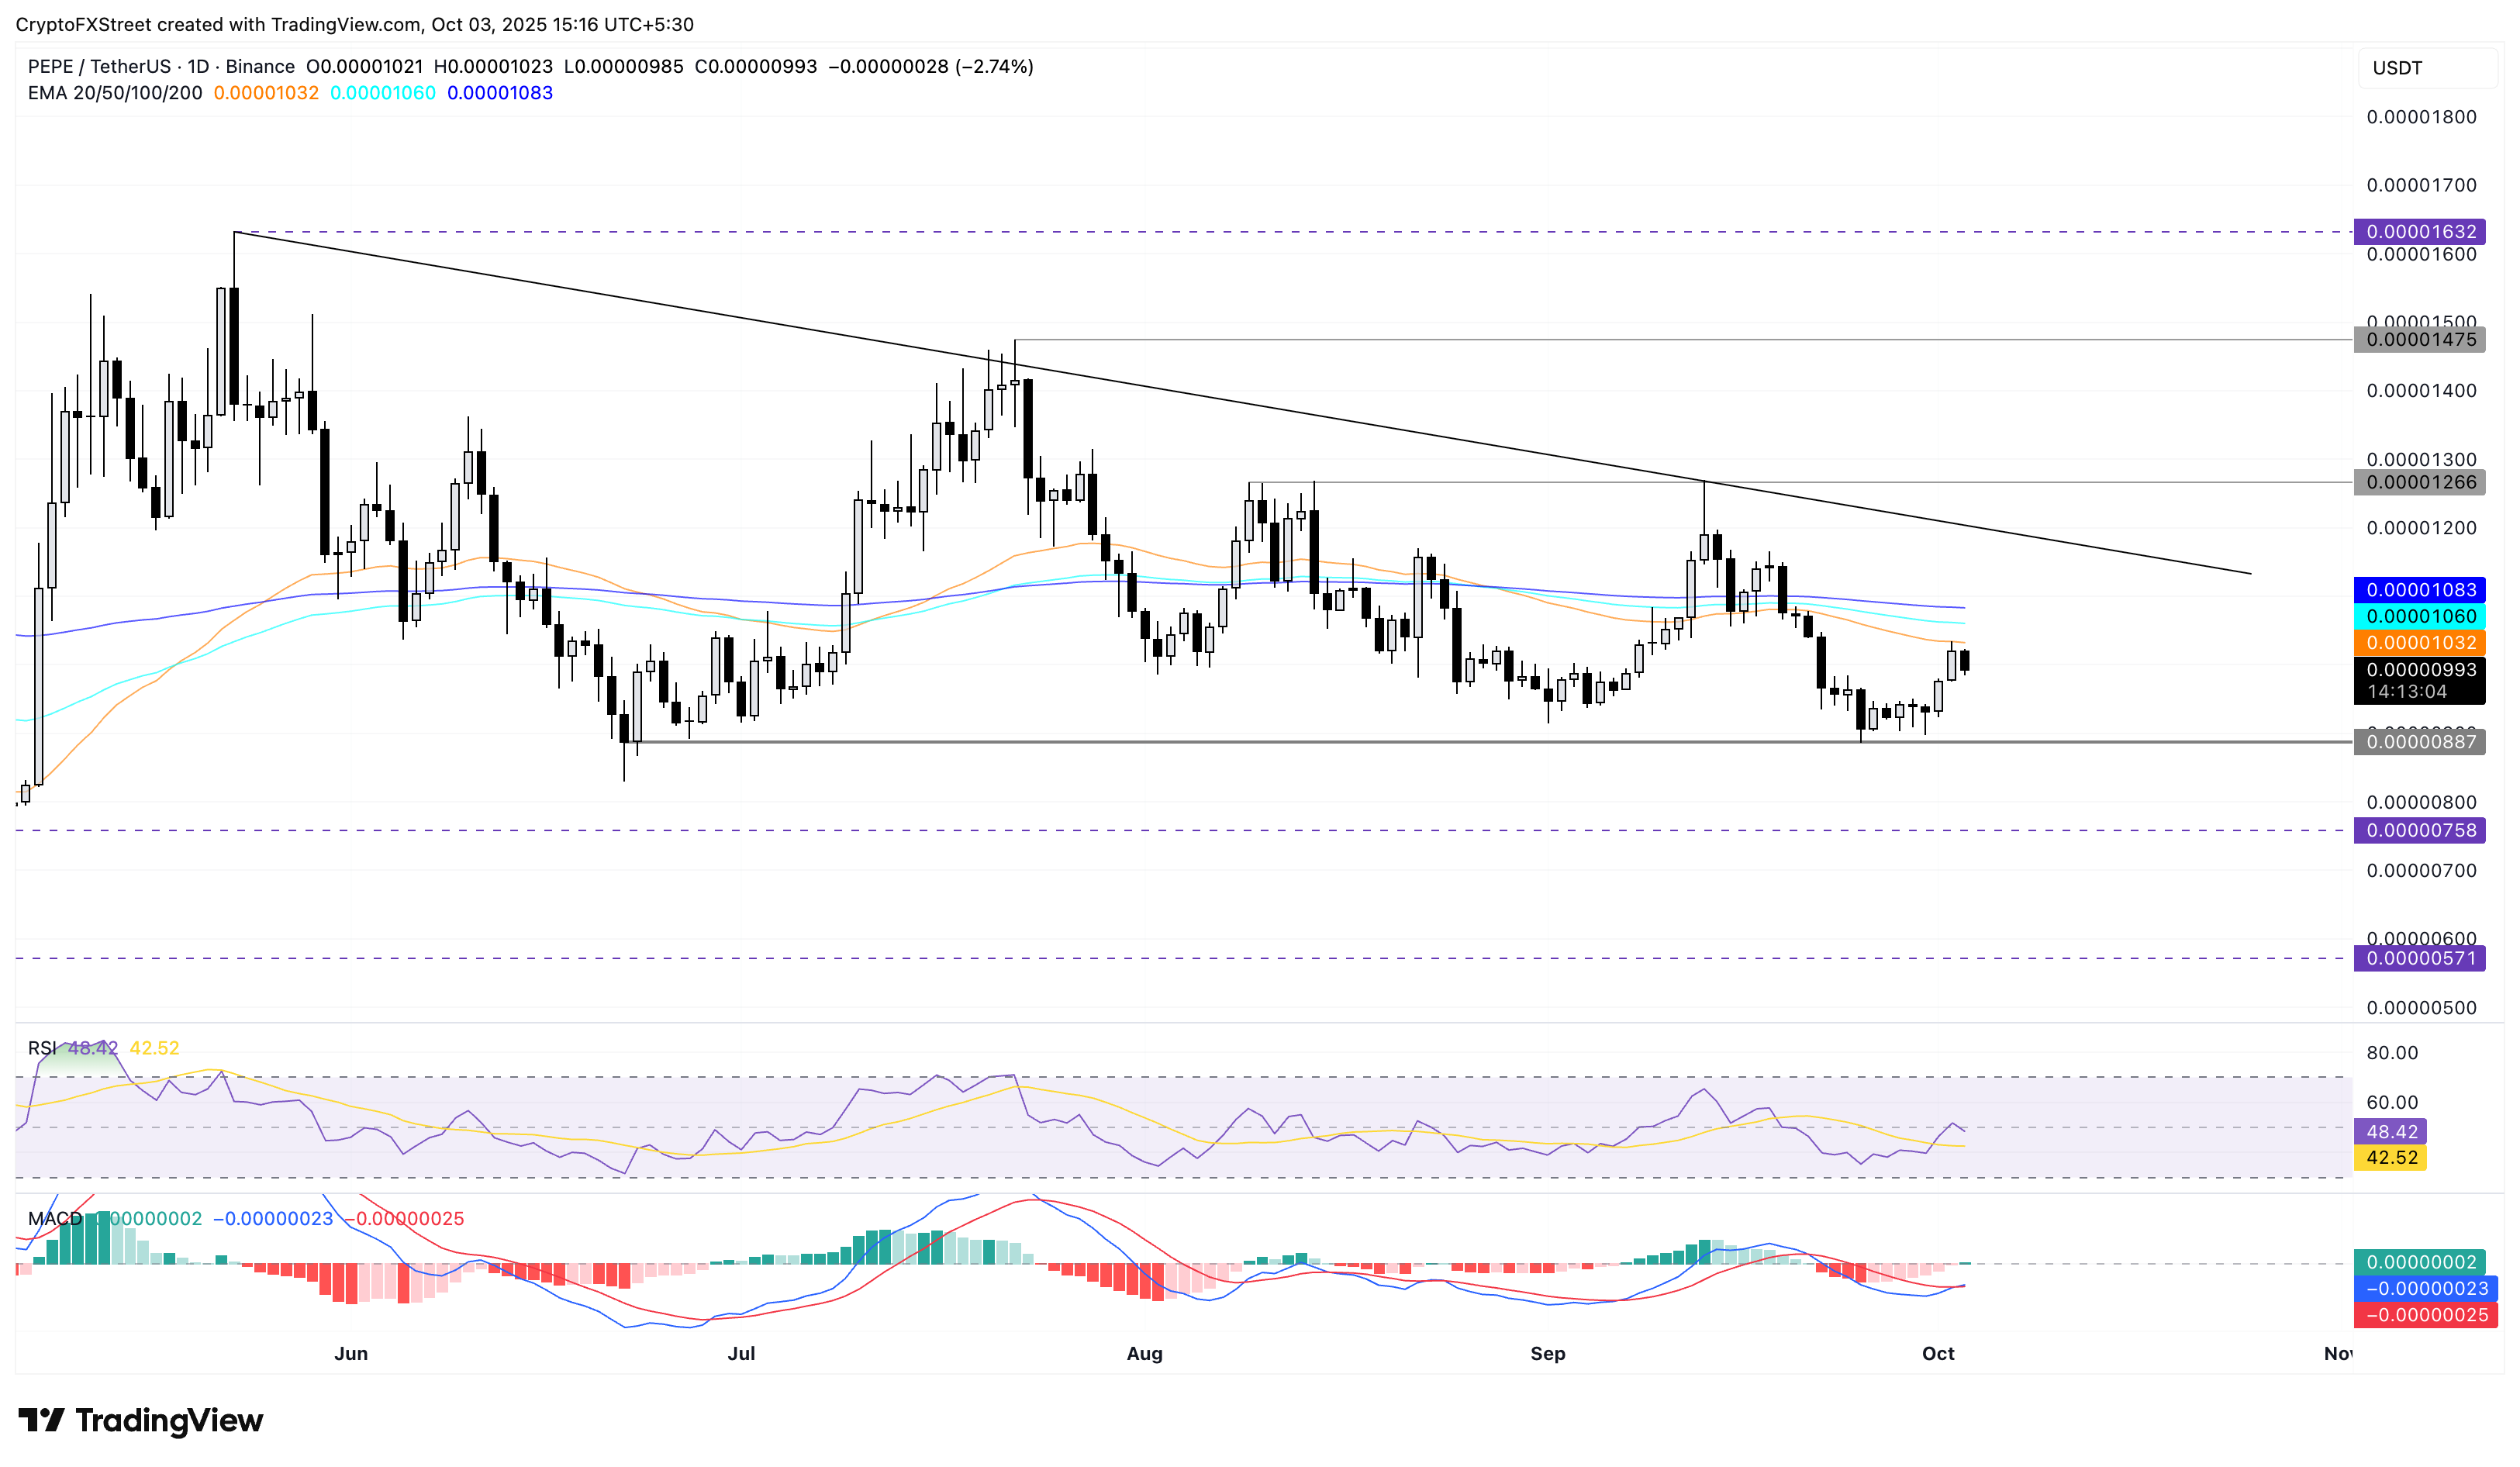
PEPE/USDT daily price chart.
If PEPE exceeds the 50-day EMA at $0.00001032, it could test the 200-day EMA at $0.00001083, followed by the overhead resistance trendline at $0.00001200, which is formed by connecting the May 23 and September 13 peaks.
Author

Vishal Dixit
FXStreet
Vishal Dixit holds a B.Sc. in Chemistry from Wilson College but found his true calling in the world of crypto.


