Meme Coins Price Prediction: DOGE, SHIB, PEPE weaken as retail demand wanes
- Dogecoin risks extending the losses below last week’s low as selling pressure increases.
- Shiba Inu’s reversal from a key resistance trendline pressures a local support level.
- Pepe drops below the $0.00000500 psychological level as retail demand lowers.
Meme coins, such as Dogecoin (DOGE), Shiba Inu (SHIB), and Pepe (PEPE), are under pressure after losing gains from November 7, retracing to key support levels. The fading demand for meme coins in the derivatives market suggests a risk-off sentiment among traders, anticipating further losses.
Crypto market grows averse to meme coins
Meme coins are losing the retail interest as traders grow risk-averse due to intense broader market volatility. The futures Open Interest (OI) of Dogecoin and Shiba Inu has decreased by 1%-2%, respectively, over the last 24 hours, reaching $1.63 billion and $80.84 million. Meanwhile, Pepe suffers an almost 10% decline in the notional value of all active futures contracts in the same time period, standing at $176.78 million.
Furthermore, the trading volume of DOGE, SHIB and PEPE experienced a surge of nearly 20% or more over the last 24 hours. In line with the decline in meme coin prices, a rise in trading volume indicates a sell-off wave.

Dogecoin extends losses from last week
Dogecoin trades above the $0.15000 level at press time on Tuesday and could break the $0.15159 support marked by the November 4 low. The meme coin risks extending the breakout-retest-continuation pattern of the $0.18000 zone, as previously reported by FXStreet.
If DOGE clears below $0.15159 with a decisive daily close, it could test the $0.12986 level, aligning with the April 7 low.
The momentum indicators on the daily chart suggest a bearish trend in the DOGE price. The Relative Strength Index (RSI) at 34 hovers above the oversold zone, indicating renewed selling pressure, and the Moving Average Convergence Divergence (MACD) extends below the signal line after a crossover on Sunday, suggesting persistent bearish momentum.
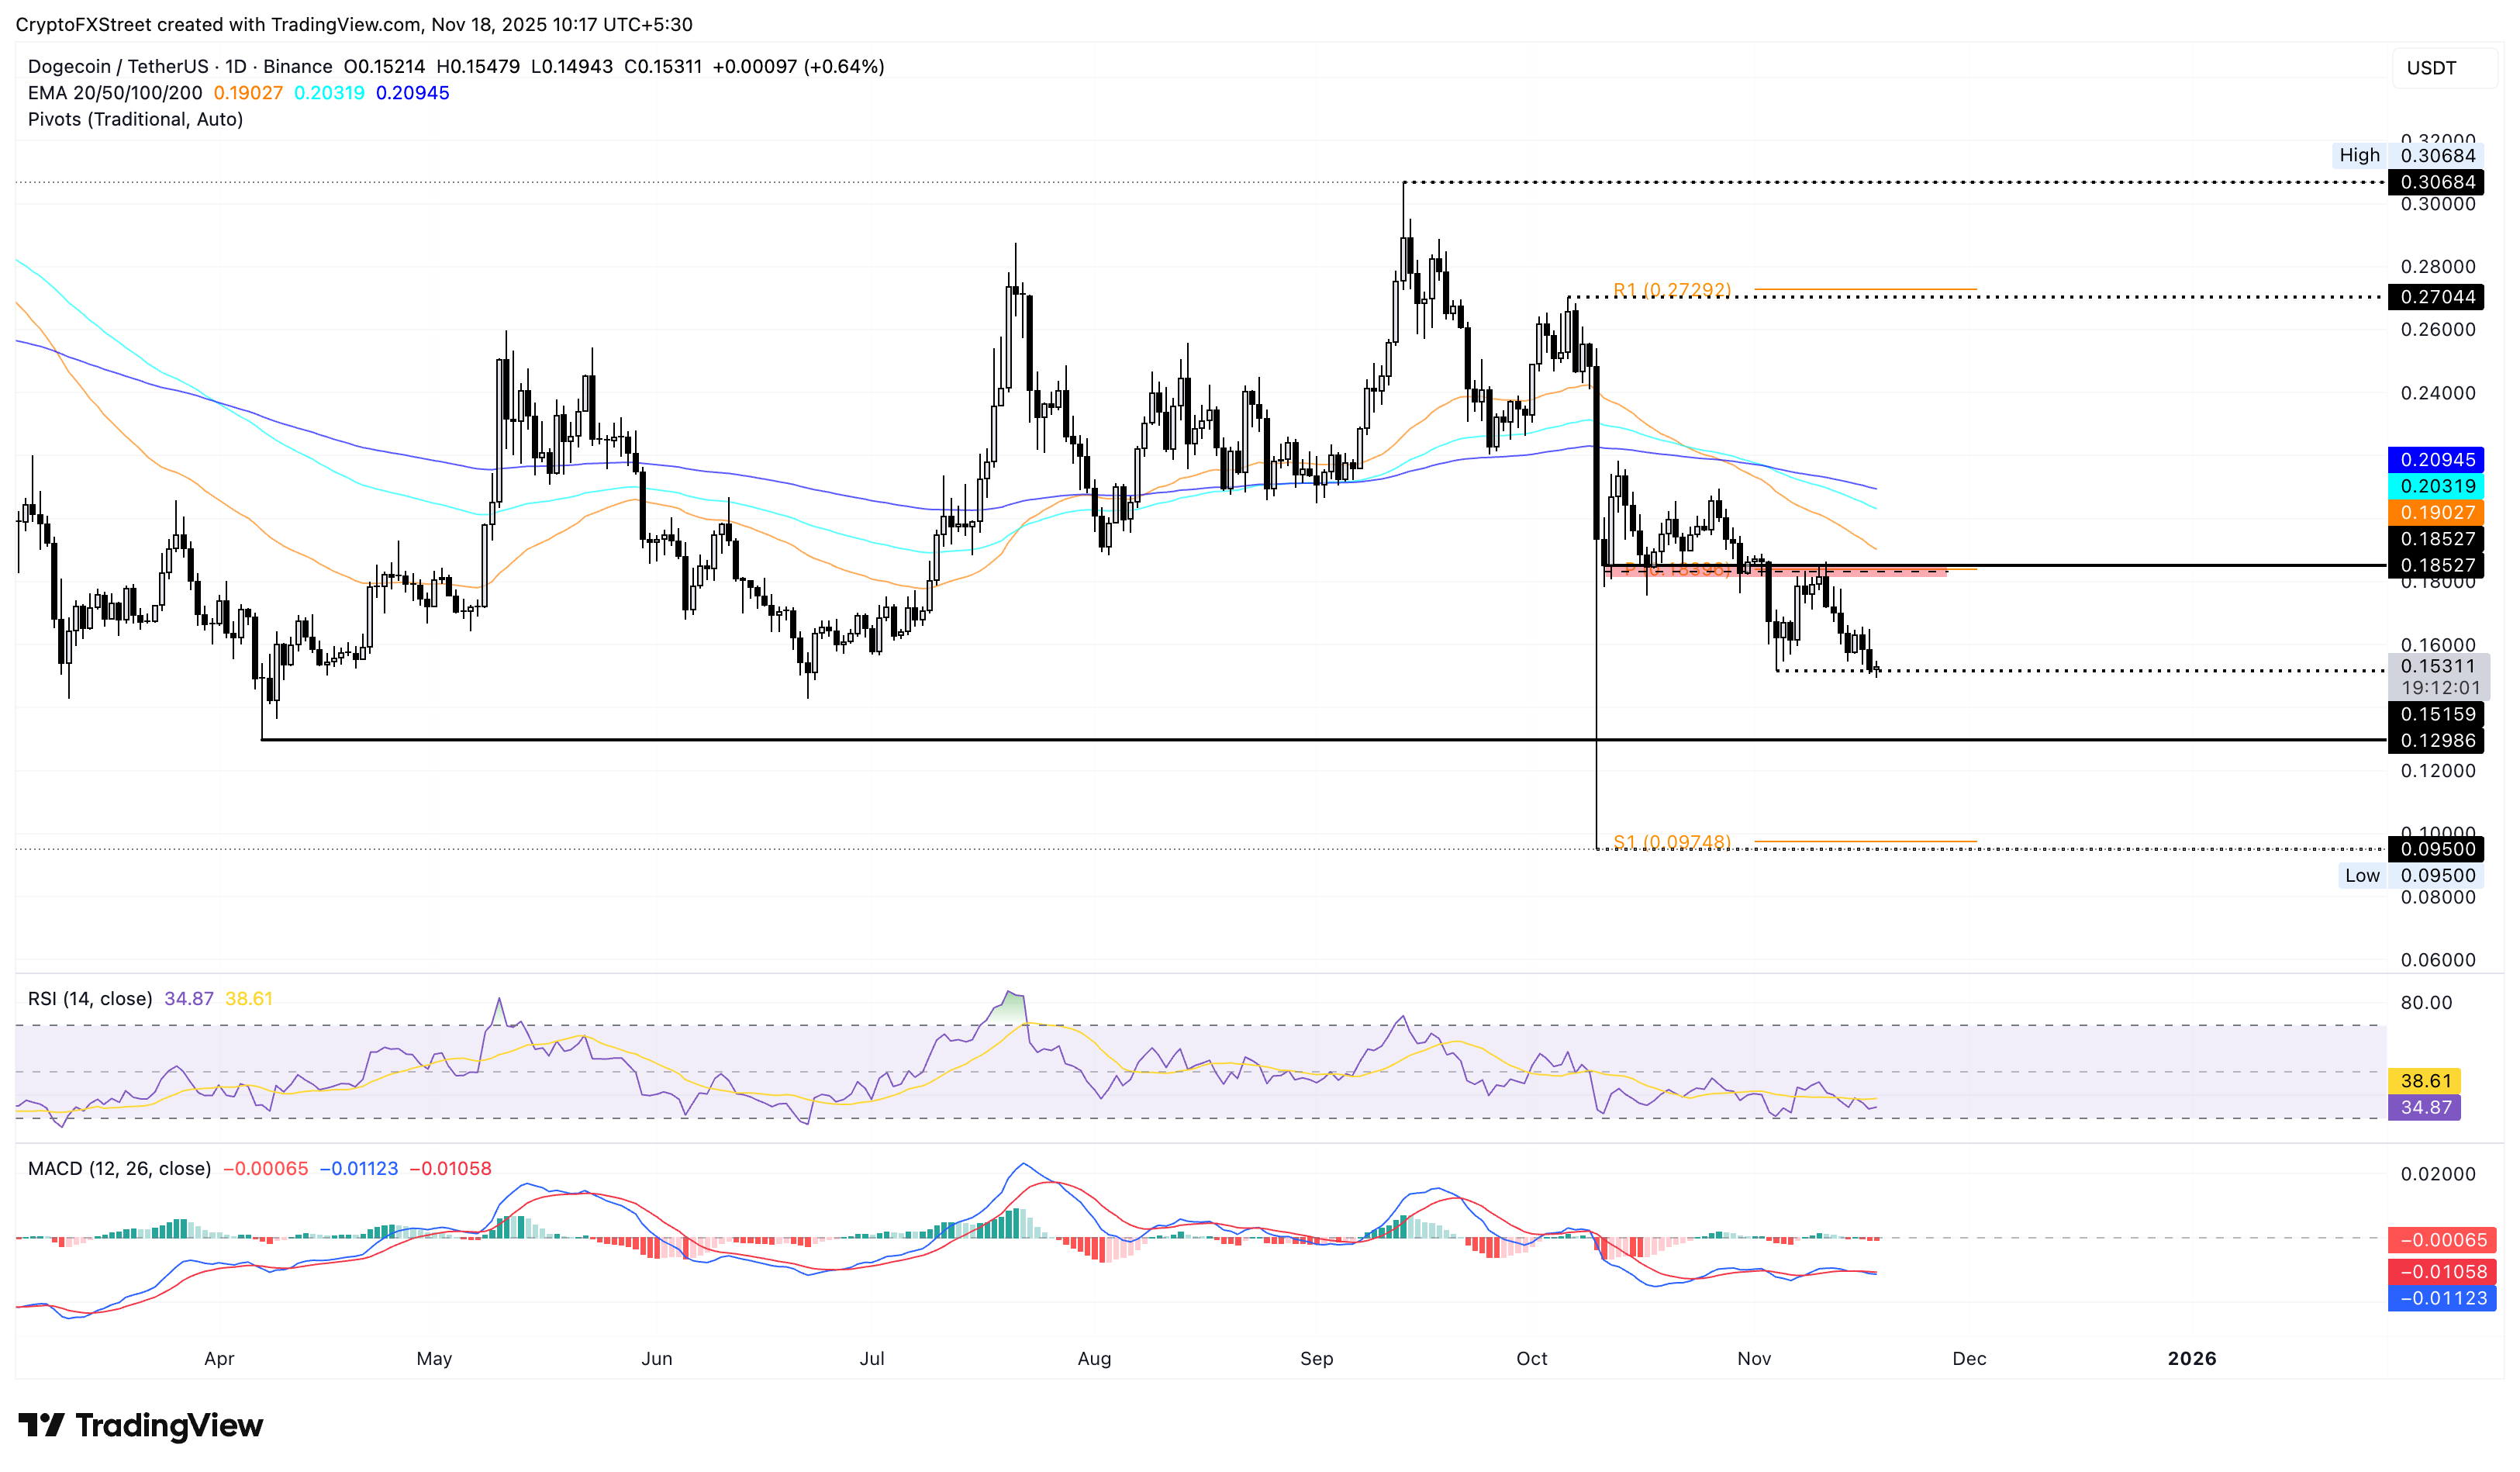
However, if DOGE bounces back from $0.15159 to close above $0.18000 on a daily basis, it could reinstate an uptrend.
Shiba Inu risks breaking below a key support
Shiba Inu dropped below $0.00000900 on Monday, after seven days of a downtrend. At the time of writing, SHIB recovers by more than 1%, holding above the November 4 low at $0.00000837.
If SHIB slips below this key support, it could extend the decline to the $0.00000678 level marked by the October 10 low, which was the day the crypto market lost over $19 billion.
Similar to Dogecoin, the momentum indicators suggest a bearish bias for Shiba Inu, as the RSI at 36 indicates strong selling pressure, while the MACD displays a negative trend in its average lines.

Looking up, if SHIB rebounds from $0.00000837, it could test the local resistance trendline formed by connecting the highs of September 13 and November 14, at $0.00000956.
Pepe in a freefall flashes 40% downside risk
Pepe recorded a 20% drop last week by extending the breakout-retest-continuation of the $0.00000650 zone. The frog-themed meme coin trades below the $0.00000500 psychological level, recording nearly 2% gains, at press time.
The declining trend in PEPE is pointing towards the October 10 low at $0.00000279, suggesting a downside risk of over 40%. However, key support near round figures of $0.00000400 and $0.00000300 could act as speed bumps to absorb incoming supply, providing reversal opportunities.
Similar to other top meme coins, Pepe's RSI and MACD indicators on the daily chart flash a bearish signal.
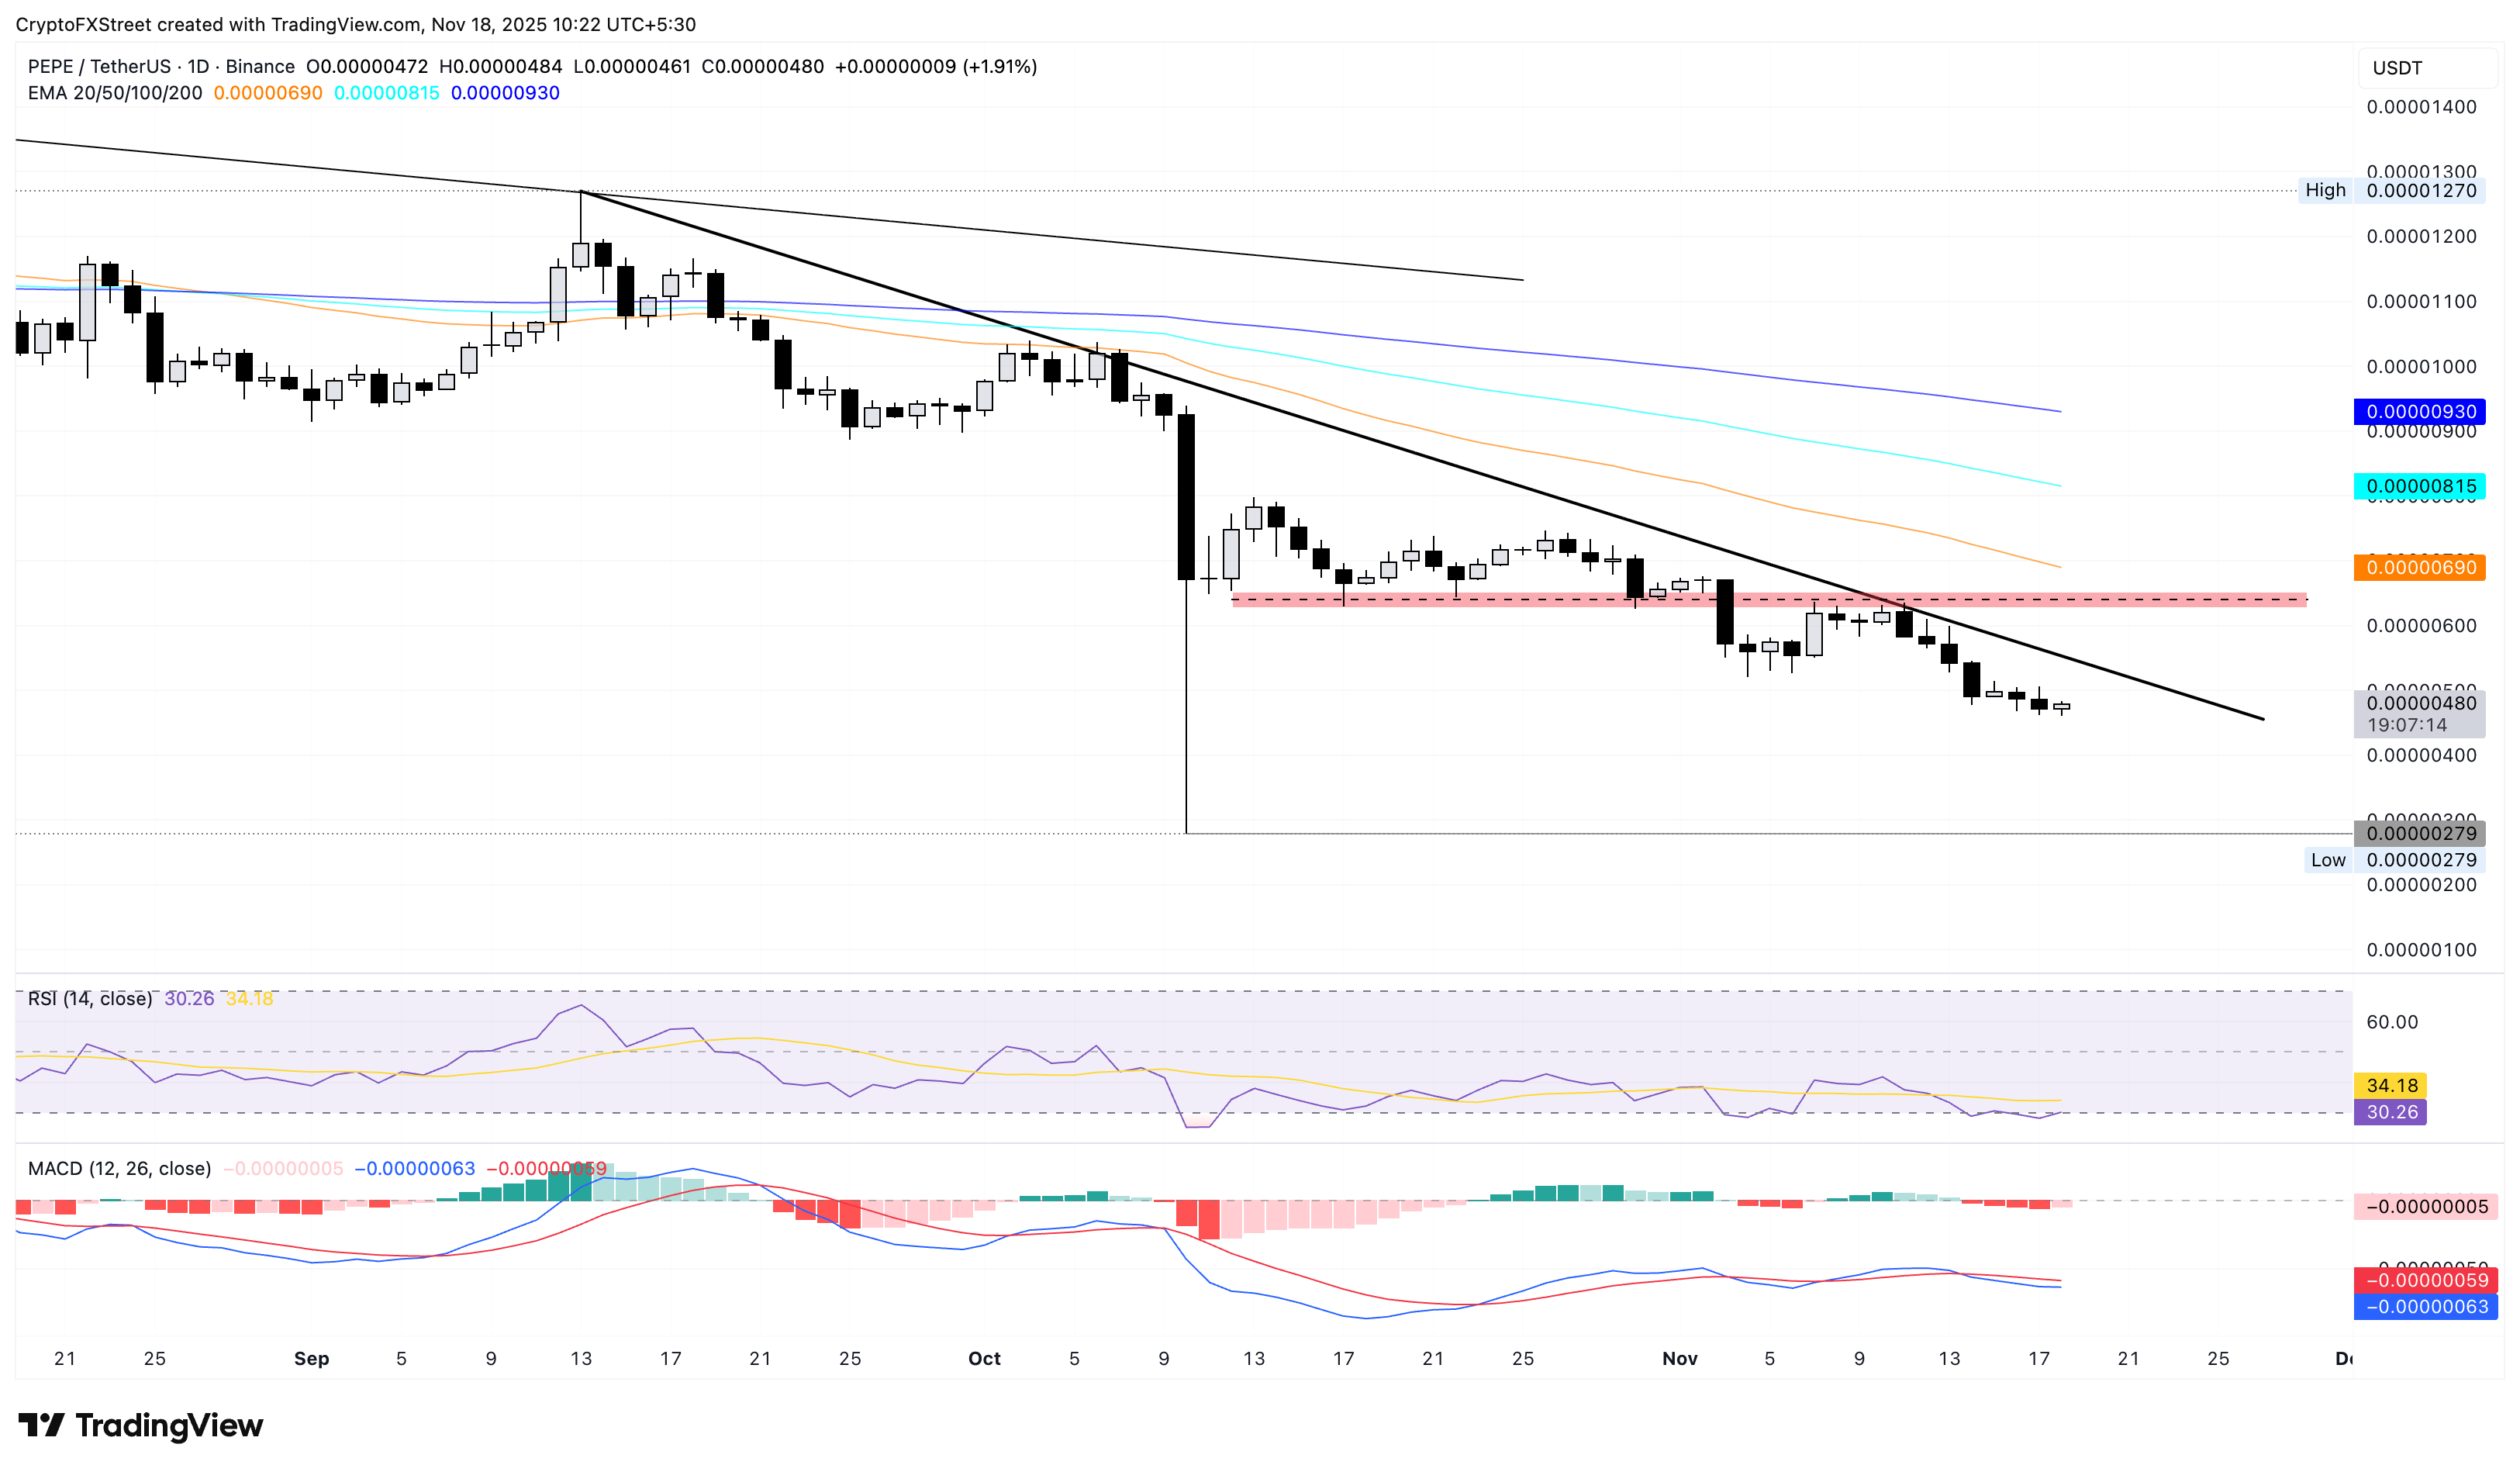
To reinstate an uptrend, PEPE should reclaim the $0.00000650 supply zone.
Author

Vishal Dixit
FXStreet
Vishal Dixit holds a B.Sc. in Chemistry from Wilson College but found his true calling in the world of crypto.



