Meme Coins Price Prediction: DOGE, SHIB, PEPE at risk as bullish momentum, Open Interest declines
- Dogecoin edges higher by over 1% following the 6% drop on Monday.
- Shiba Inu ticks higher from the 50-day EMA as bullish momentum declines.
- Pepe finds support at the 50-day EMA following the nearly 7% loss on Monday.

Meme coins, such as Dogecoin (DOGE), Shiba Inu (SHIB), and Pepe (PEPE), are under pressure as the broader cryptocurrency market pulls back. The meme coins are holding crucial support levels amid declining bullish momentum and Open Interest (OI), pointing to escalating downside risk.
Dogecoin risk escalates as bullish momentum fades
DOGE edges higher by more than 1% at press time on Tuesday, signaling a minor recovery from the 6% drop on Monday. The Supertrend indicator line at $0.22 suggests an intact uptrend, while the declining Relative Strength Index (RSI) stands at 54 as it approaches the midline, indicating reduced buying pressure.
The Moving Average Convergence Divergence (MACD) on the daily chart crossed below its signal line on Sunday, flashing a sell signal. Sidelined investors could consider the average lines crossing below the zero line as the next potential sell signal.
Dogecoin’s declining trend delays the Golden Cross pattern in the 50-day and 200-day Exponential Moving Averages (EMAs).
DOGE would invalidate the uptrend if it crosses below $0.22, potentially targeting the 200-day EMA at $0.2075.
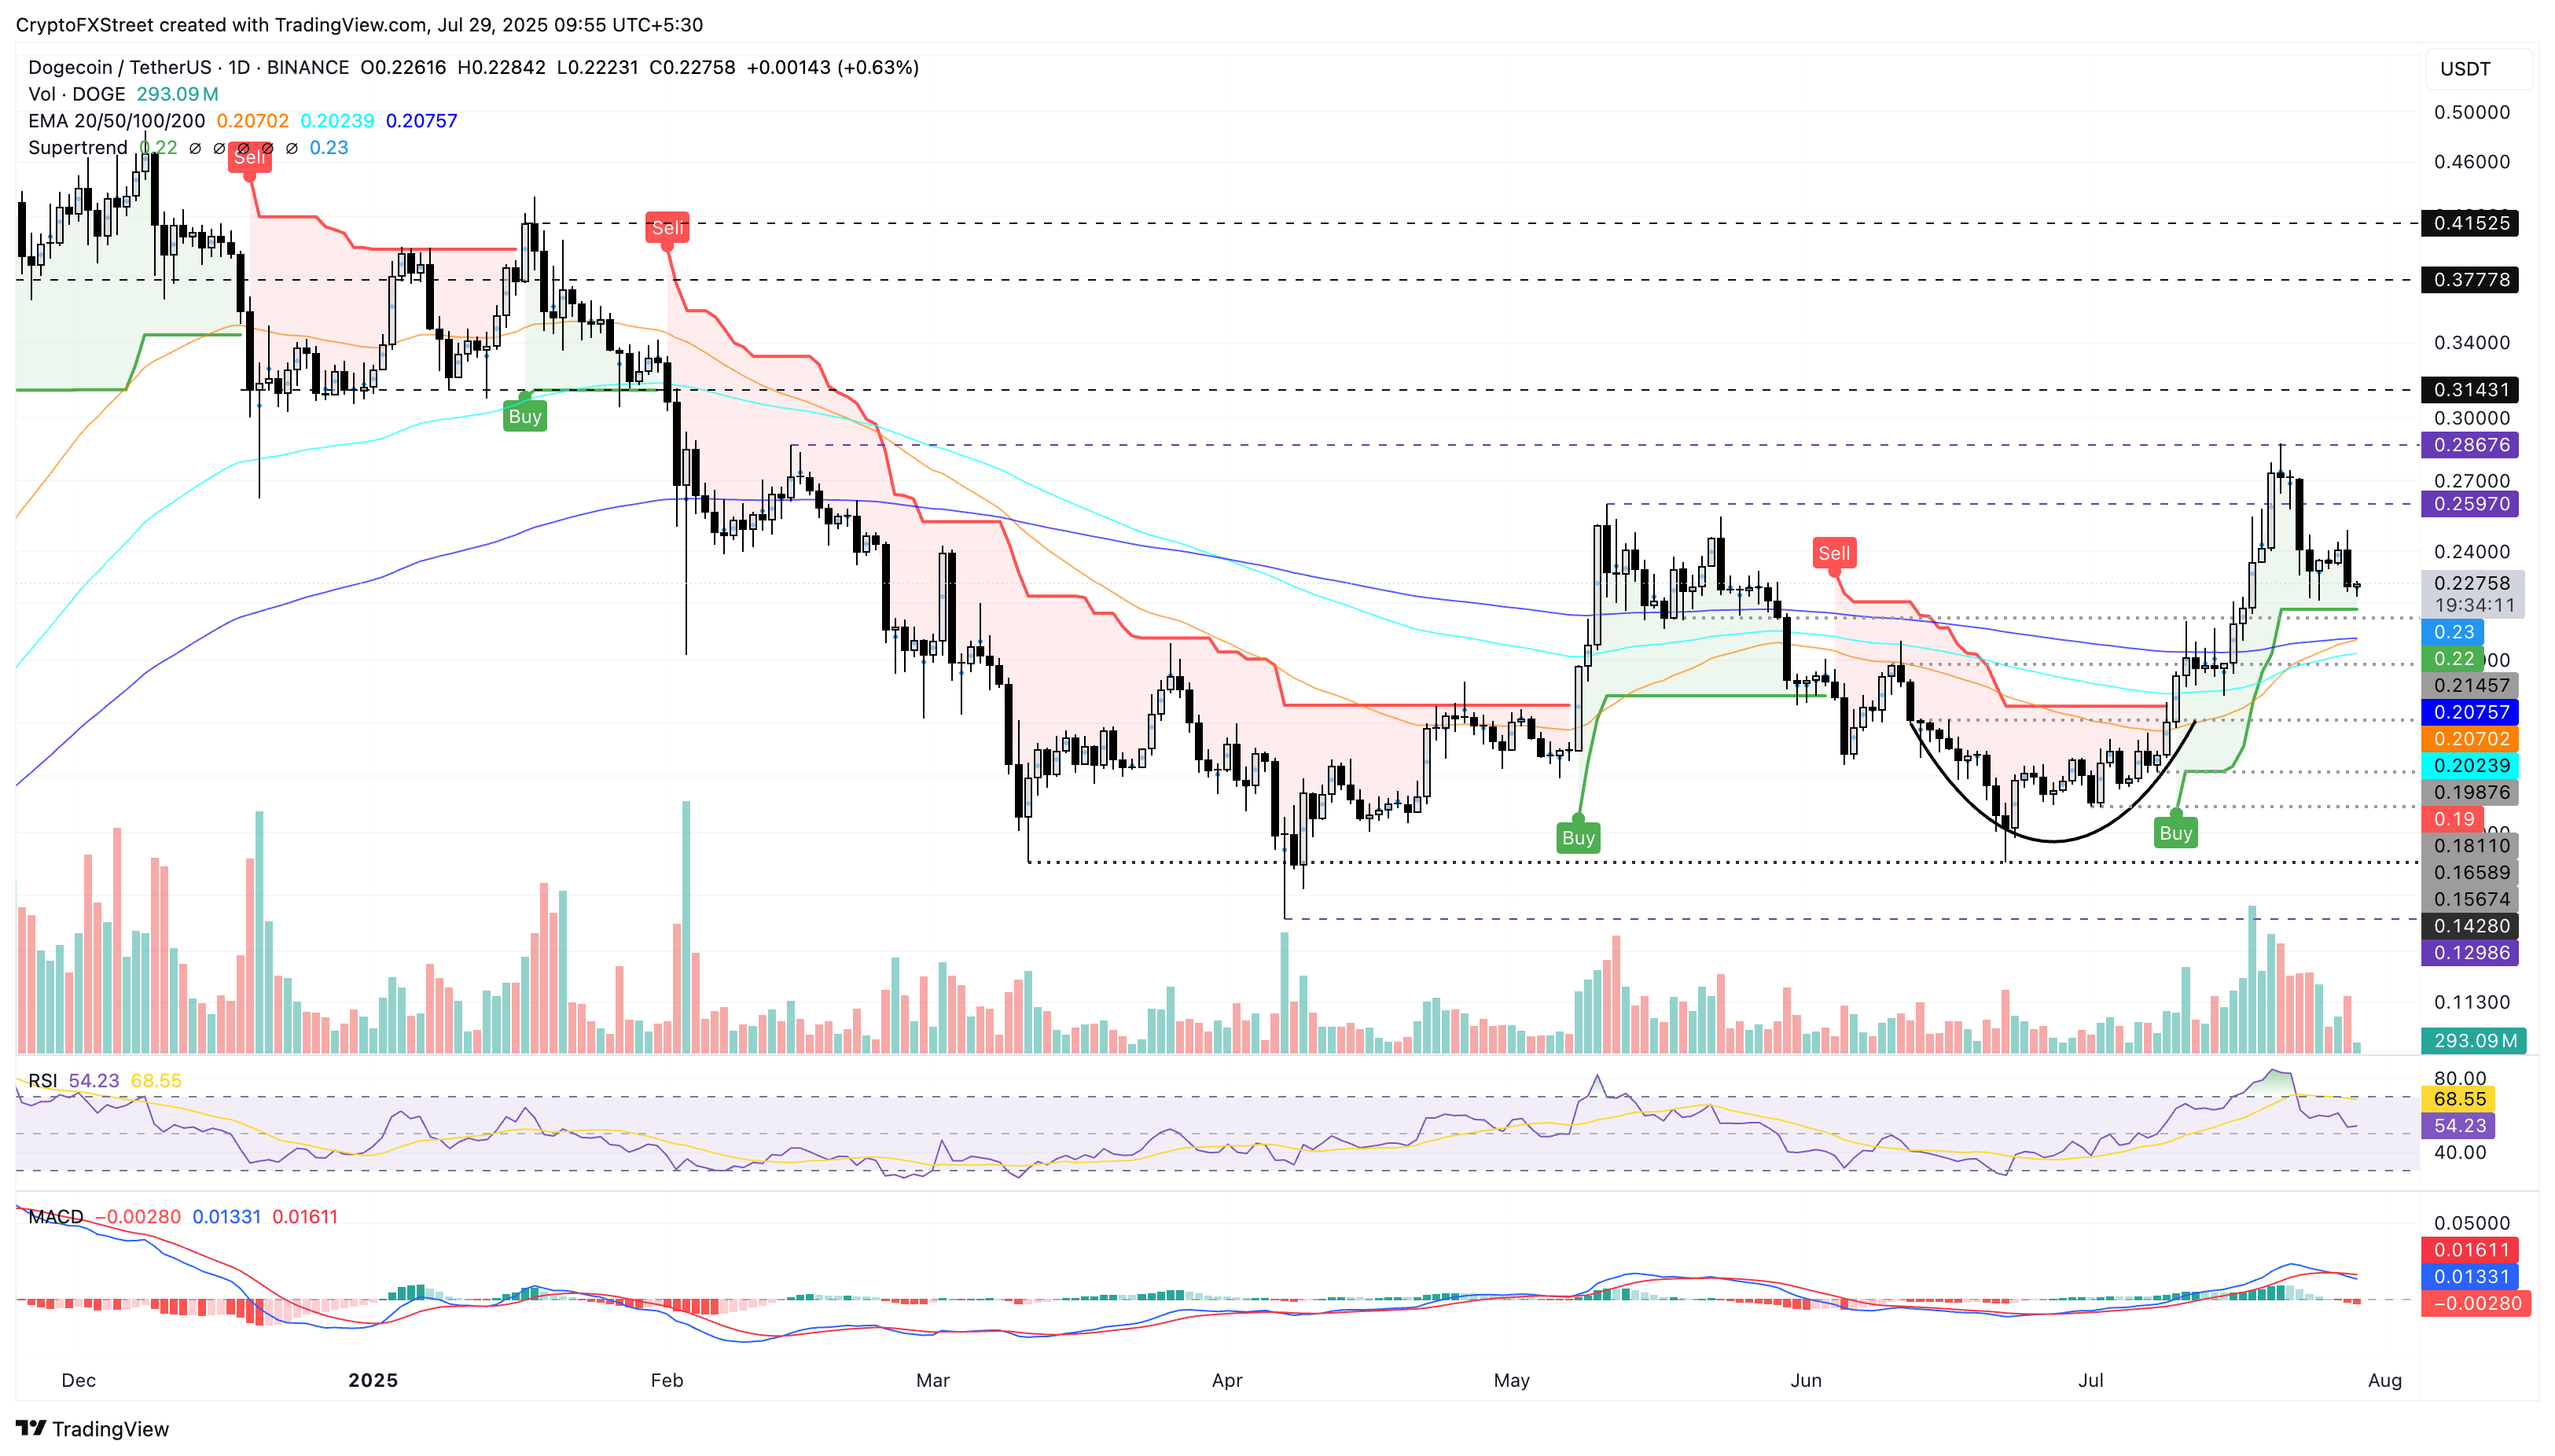
DOGE/USDT daily price chart.
Amid the declining trend, Coinglass’ data shows the DOGE Open Interest (OI) falling to $3.96 billion, down from the peak of $5.35 billion last week. Typically, a decline in OI suggests capital outflows, signaling a decrease in traders’ interest.
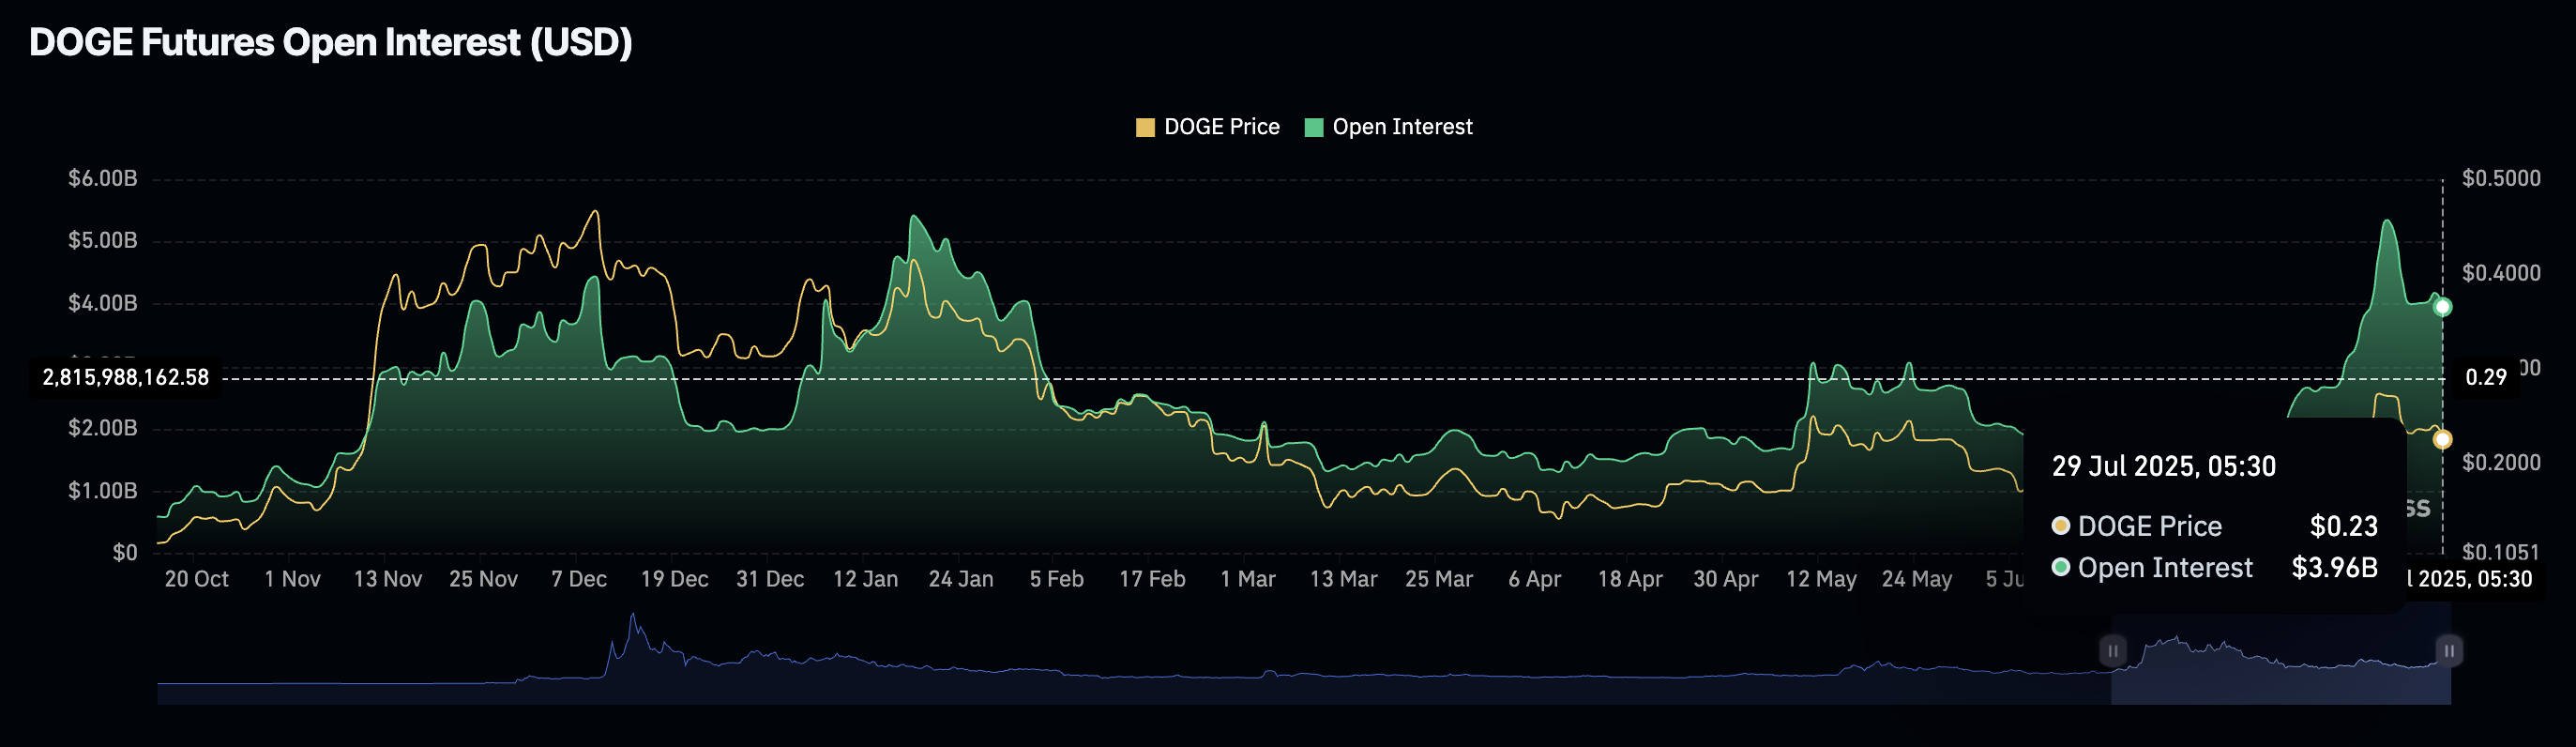
DOGE Open Interest. Source: Coinglass
On the flip side, lower shadow in Dogecoin’s intraday candle hints at a potential recovery run that could target the $0.2597 level.
SHIB at a crucial support level eyes a potential bounce back
Shiba Inu edges higher by 1% at the time of writing as it holds support at the 50-day EMA following the 5.65% drop on Monday. The meme coin struggles to float above the $0.00001337 support level, last tested on Friday.
A clean push below this level could extend the decline to $0.00001221, broken on July 9.
The technical indicators suggest a decline in bullish momentum, as the MACD and signal line flash a sell signal on Friday. Still, the RSI reads 48 as it remains in the neutral zone slightly below the zero line on the daily chart, indicating a decline in buying pressure.
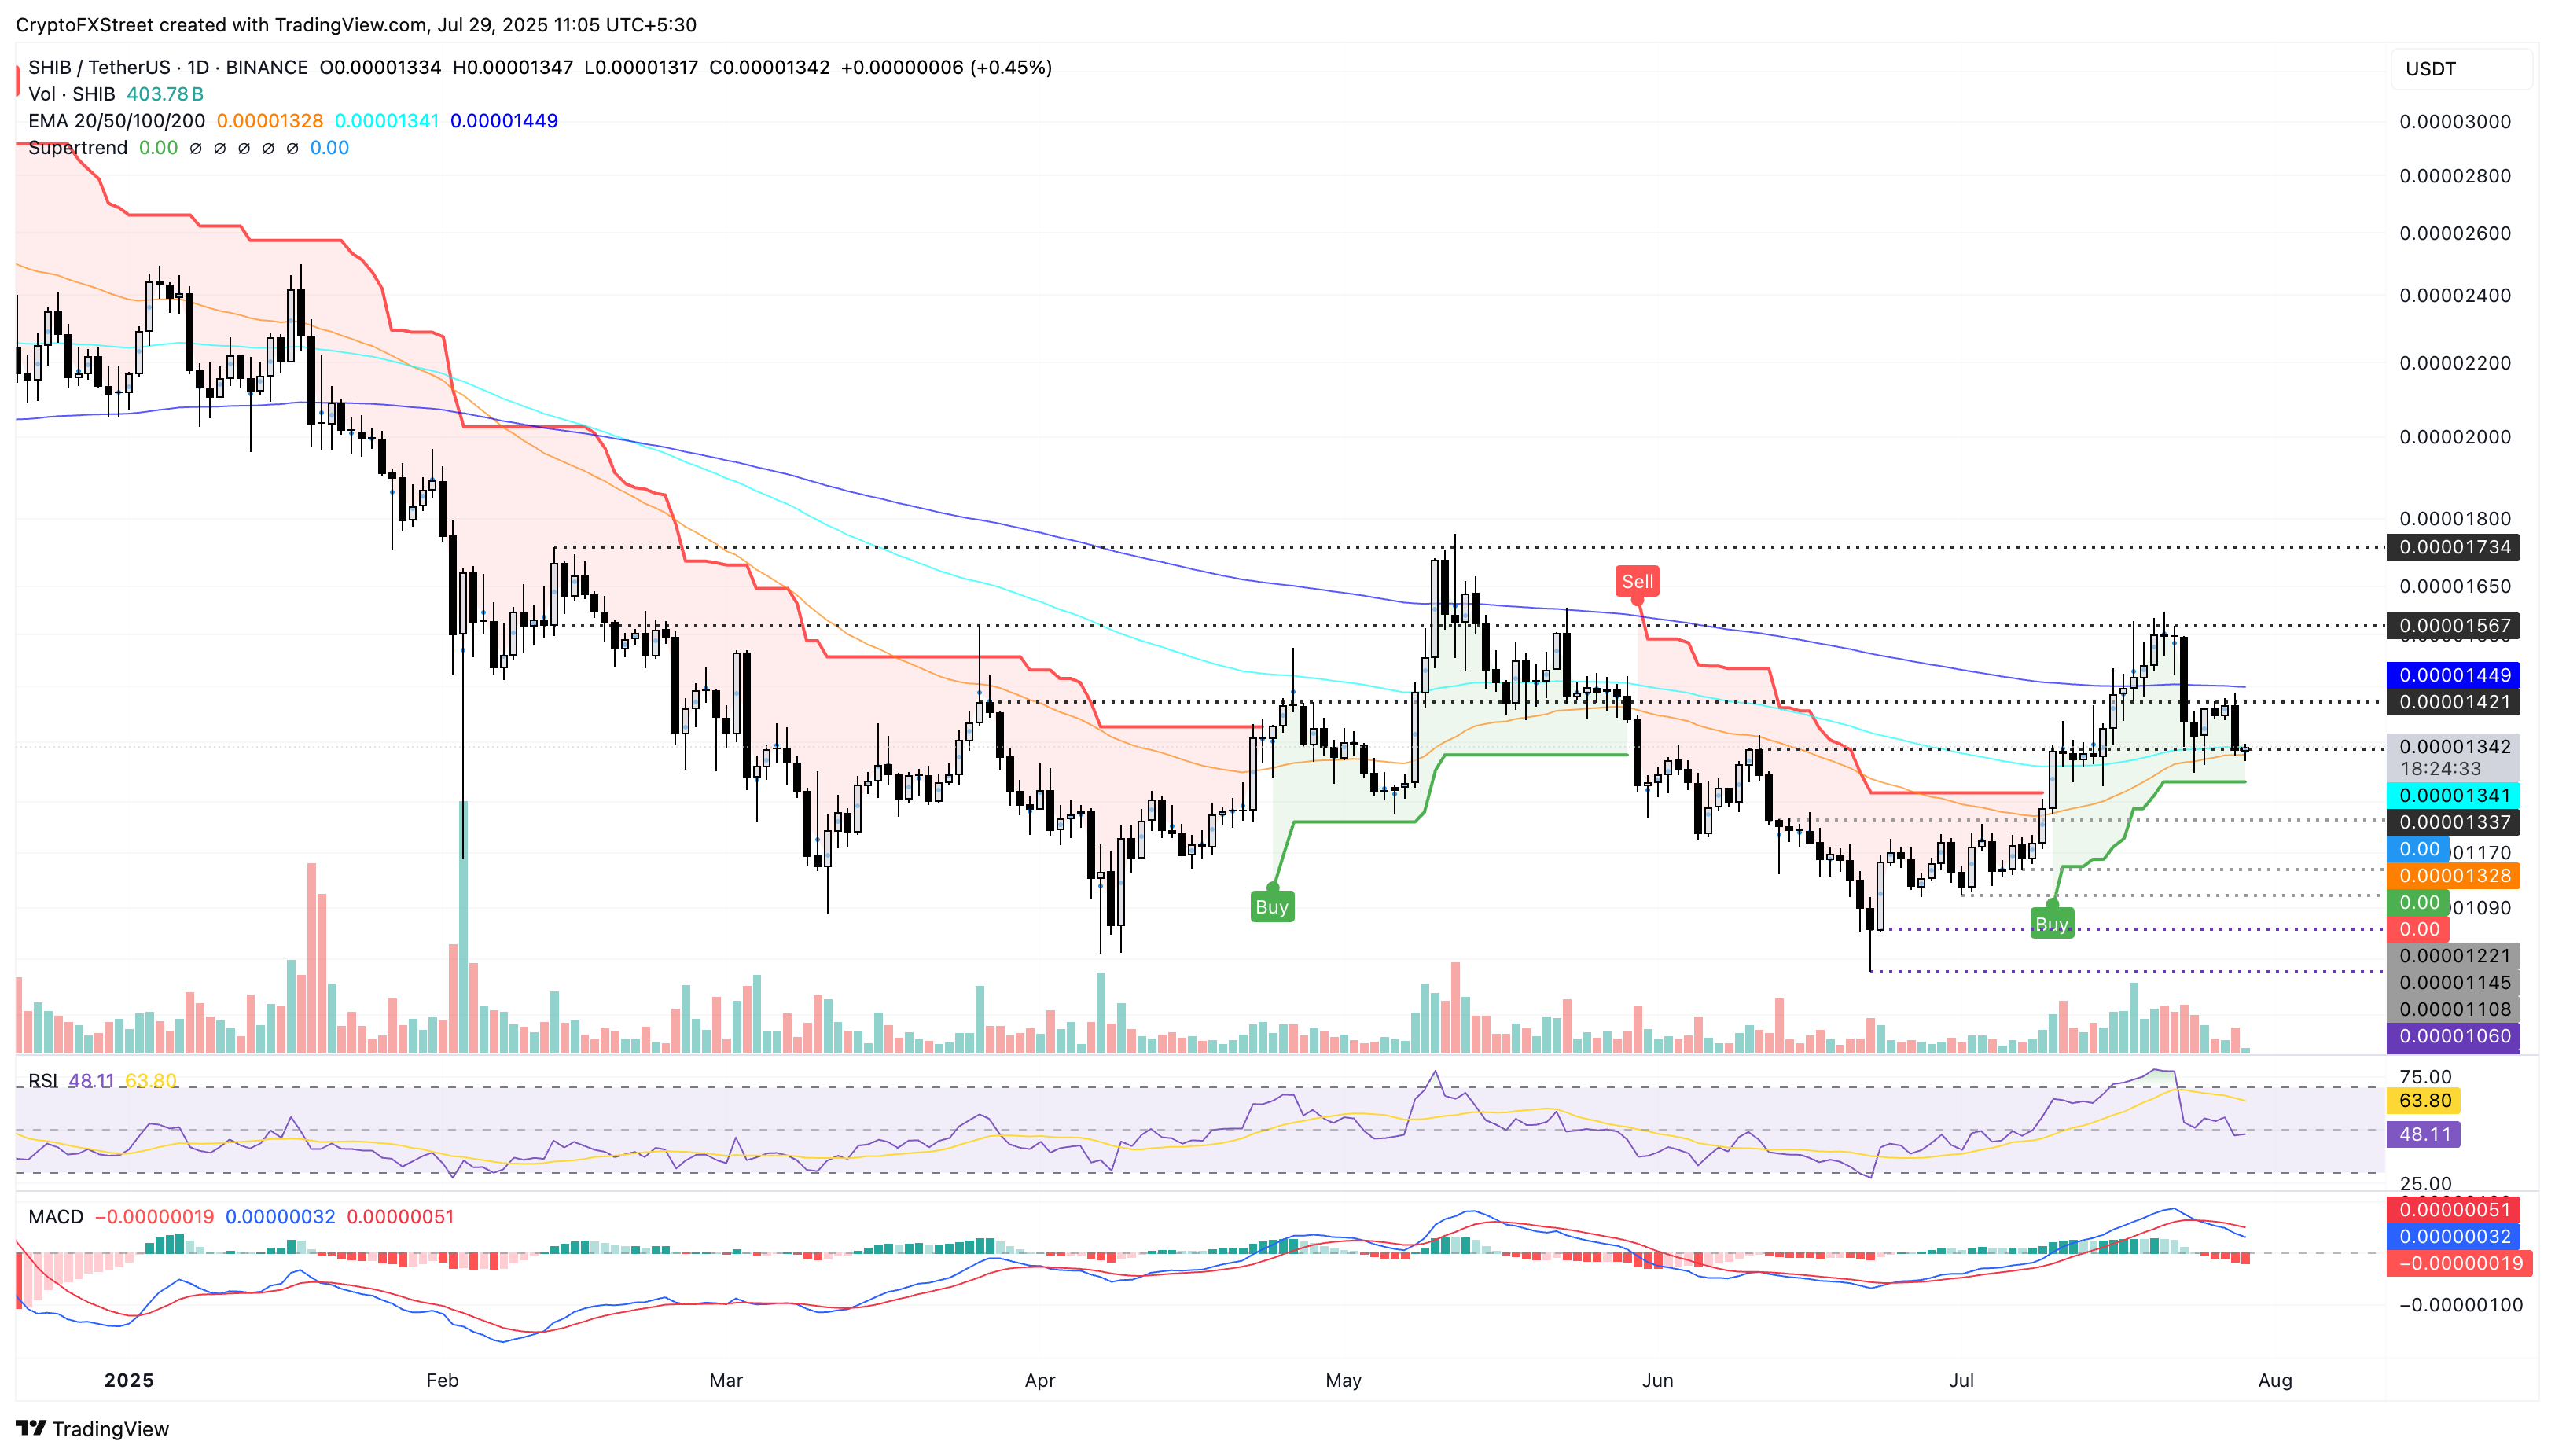
SHIB/USDT daily price chart.
The SHIB OI is falling to $212.48 million, down from $328.36 million last week, indicating a decline in traders’ interest in the second-largest meme coin.
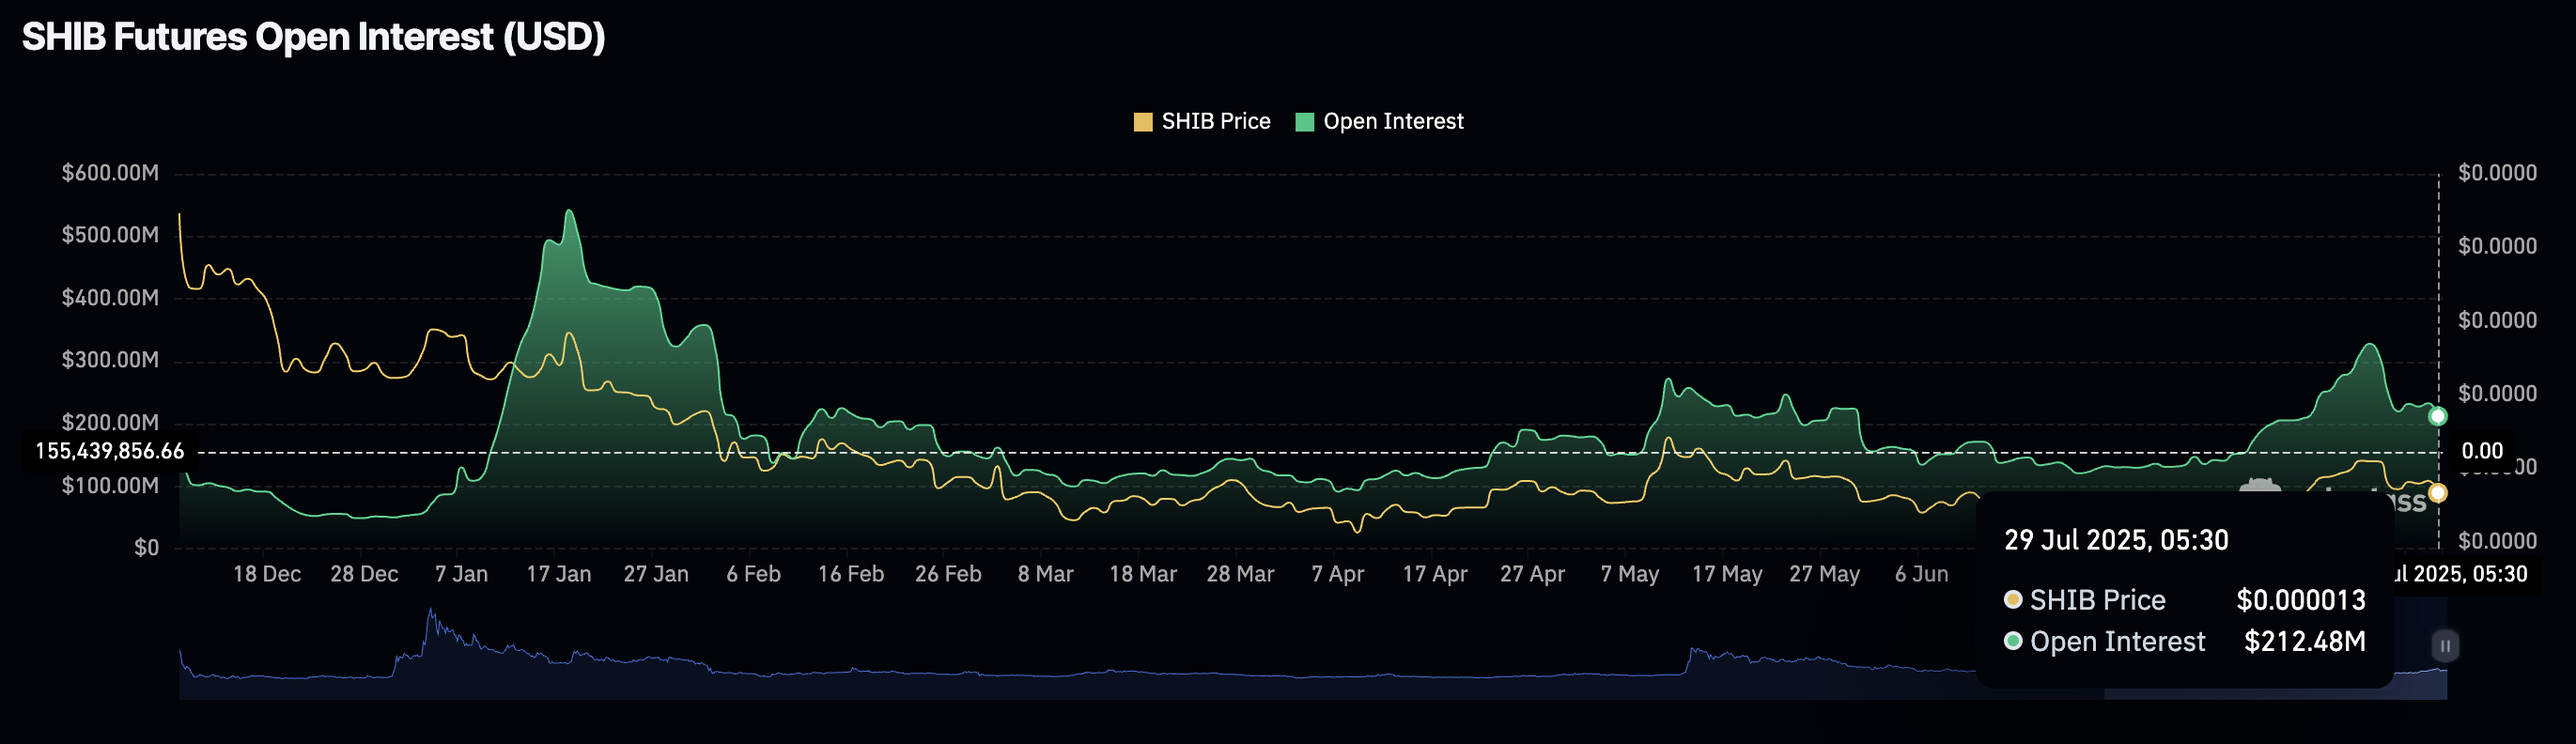
SHIB Open Interest. Source: Coinglass
To reinforce an uptrend, Shiba Inu must reclaim the 200-day EMA at $0.00001449 to challenge the $0.00001567 resistance level last tested on July 22.
PEPE struggles at the 50-day EMA, risking further losses
PEPE meme coin holds support at the 50-day EMA and the $0.00001196 level after the almost 7% drop on Monday. The uptrending 100-day and 200-day EMAs act as secondary lines of defense at $0.00001132 and $0.00001122, respectively.
If the declining trend breaches the 200-day EMA, SHIB could extend the decline to the $0.00001037 level, marked by the June 5 low.
The MACD indicator displays a new wave of red histogram bars below the zero line, pointing to increased bearish momentum. The Relative Strength Index (RSI) reads 47 as it declines below the midpoint, indicating a sharp decline in buying pressure.
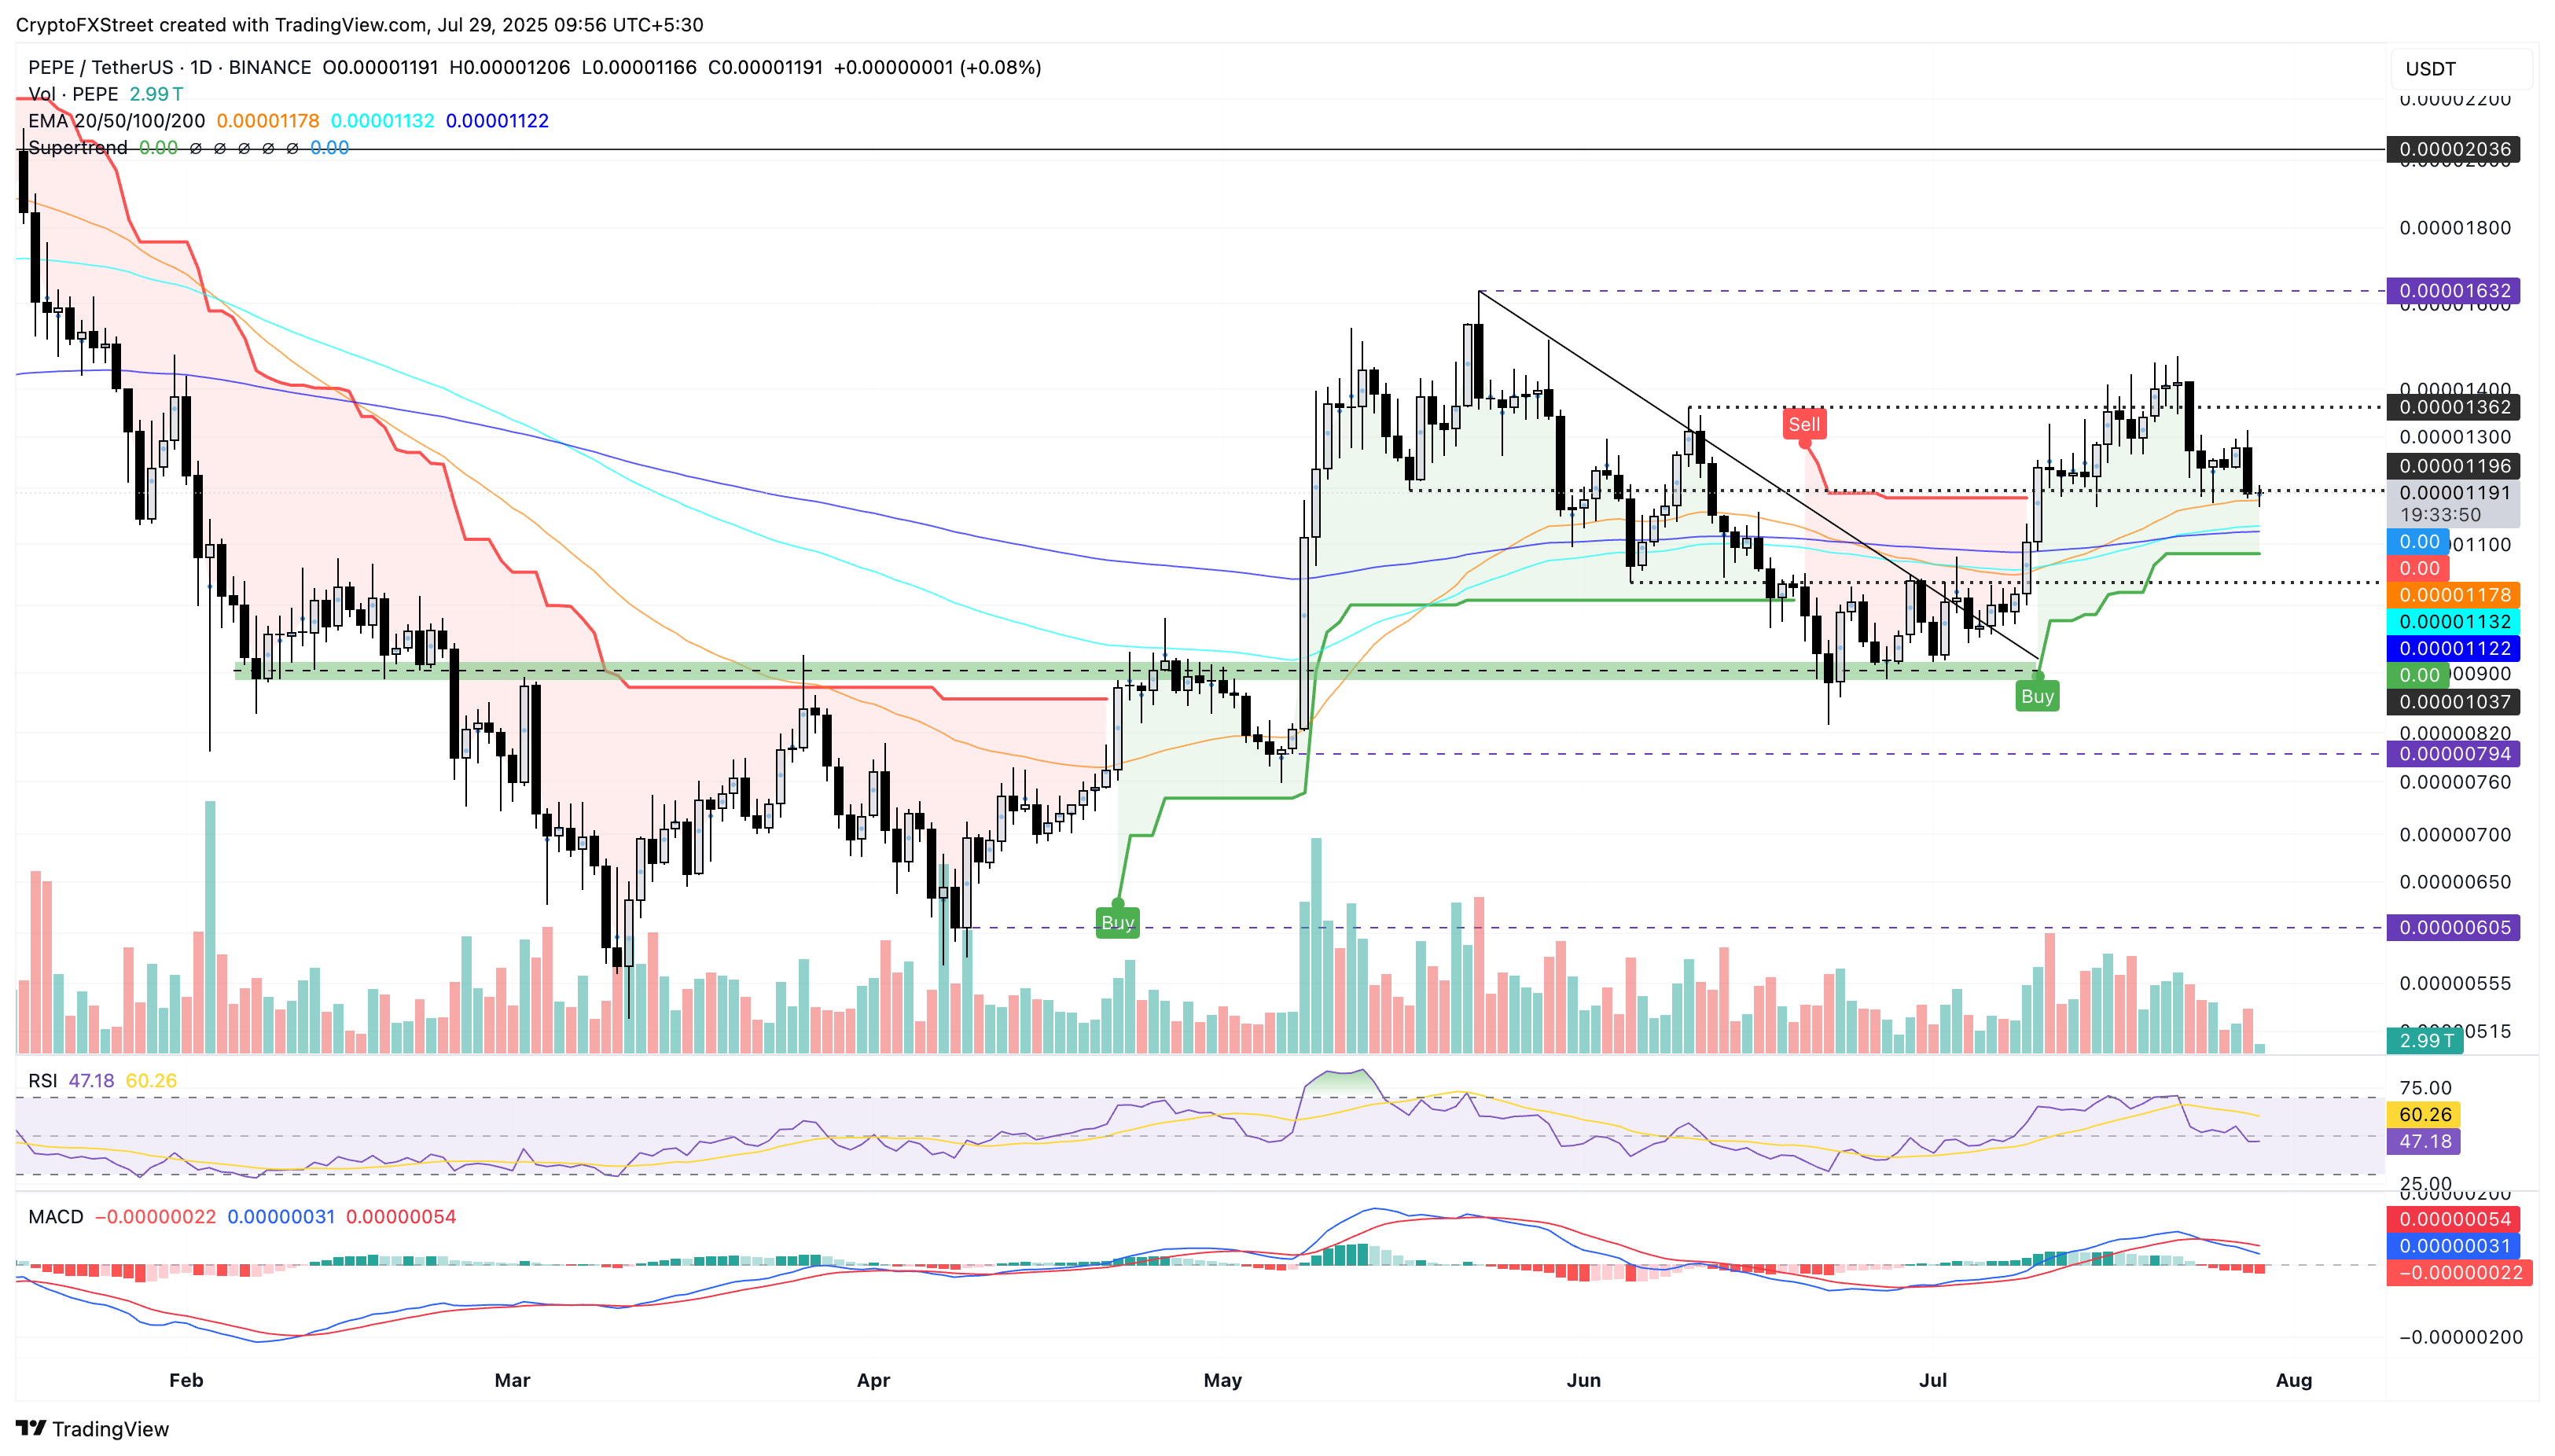
PEPE/USDT daily price chart.
Similar to other meme coins, PEPE OI has dropped from its last week's peak of $1.02 billion to $698.98 million as of Tuesday. The loss of over $300 million highlights a significant capital outflow from PEPE derivatives as traders choose to sit on the sidelines and await a decisive trend.
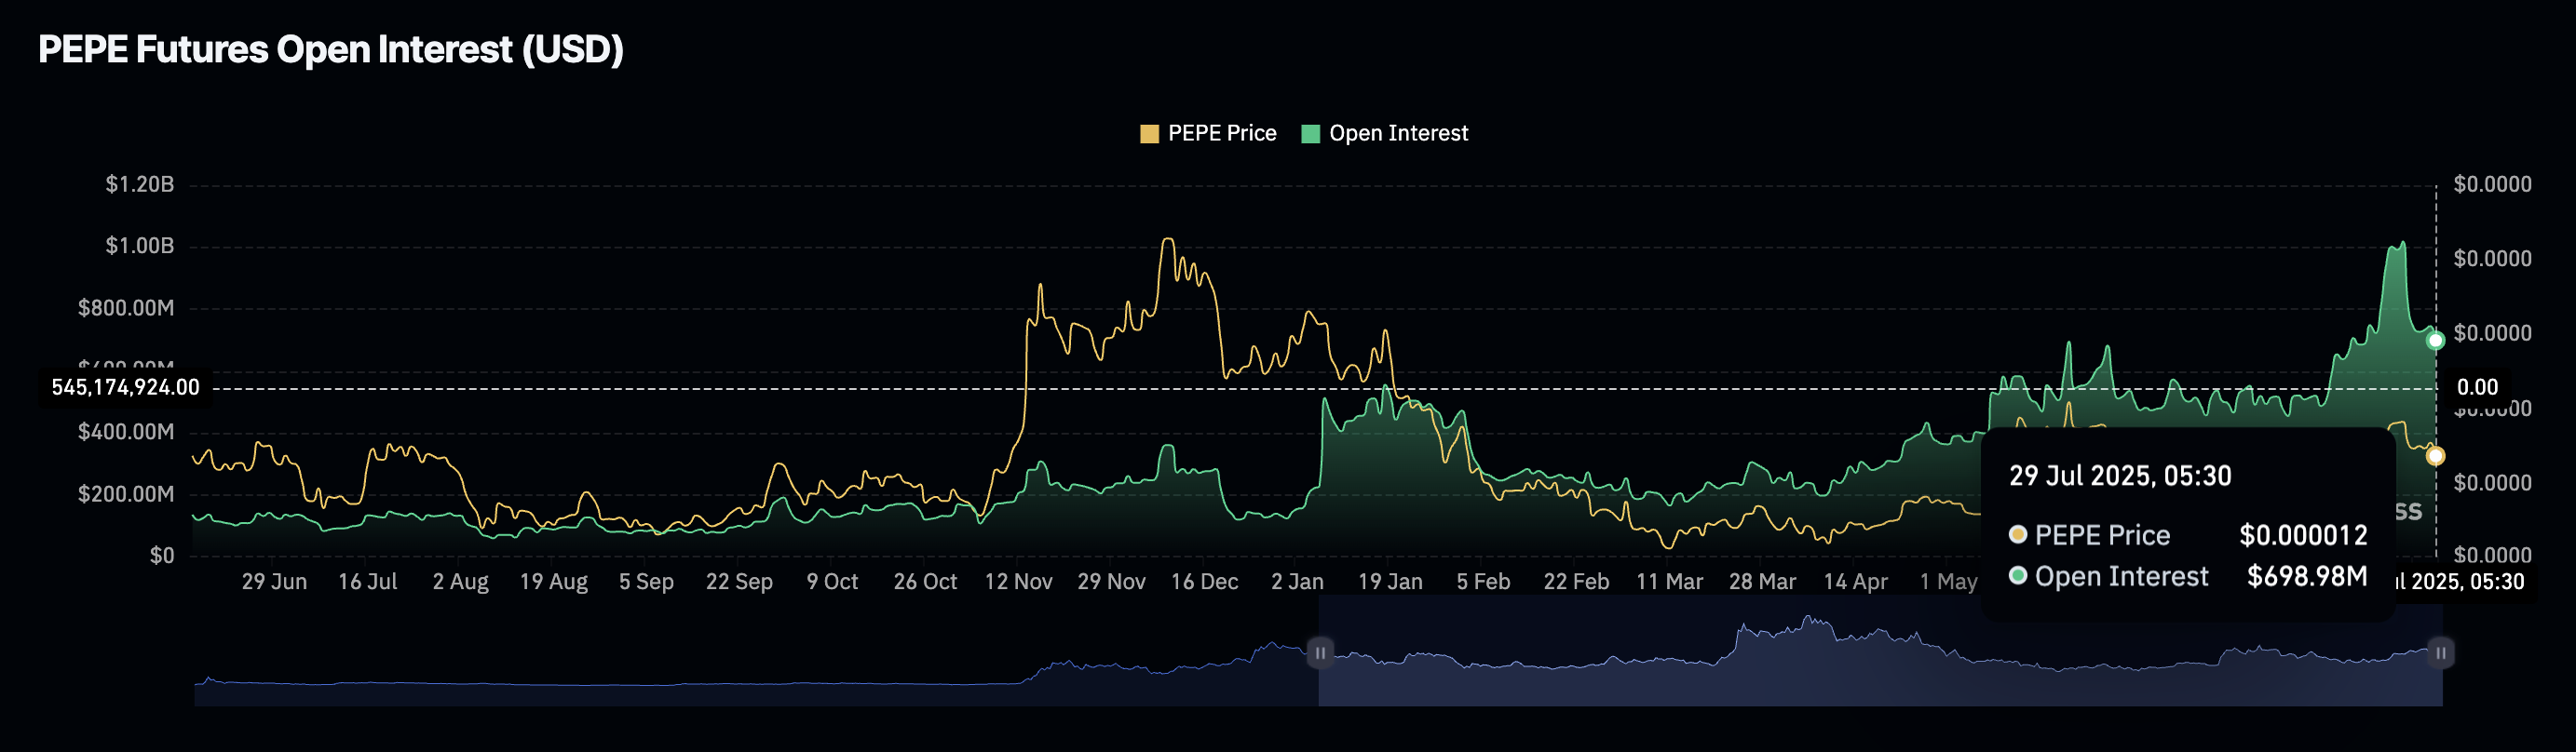
PEPE Open Interest. Source: Coinglass
On the flip side, a reversal in PEPE could target the overhead resistance at $0.00001362 level, followed by the psychological level of $0.00001500.
Author

Vishal Dixit
FXStreet
Vishal Dixit holds a B.Sc. in Chemistry from Wilson College but found his true calling in the world of crypto.



